Evidence checked September 22, 2026. Prices are direct Claude API rates in US dollars. Kingy used published evidence and did not run paid benchmark tests.
Claude Opus 5.5 is now the stronger starting choice for a new Claude coding or knowledge-work workflow. Its published results make a convincing case at medium and high effort, and its ordinary input and output prices are 60% below Fable 5.1’s. Fable still deserves a place where it has demonstrated an advantage on your particular work. Its position in the lineup alone is no longer enough reason to make it the default.
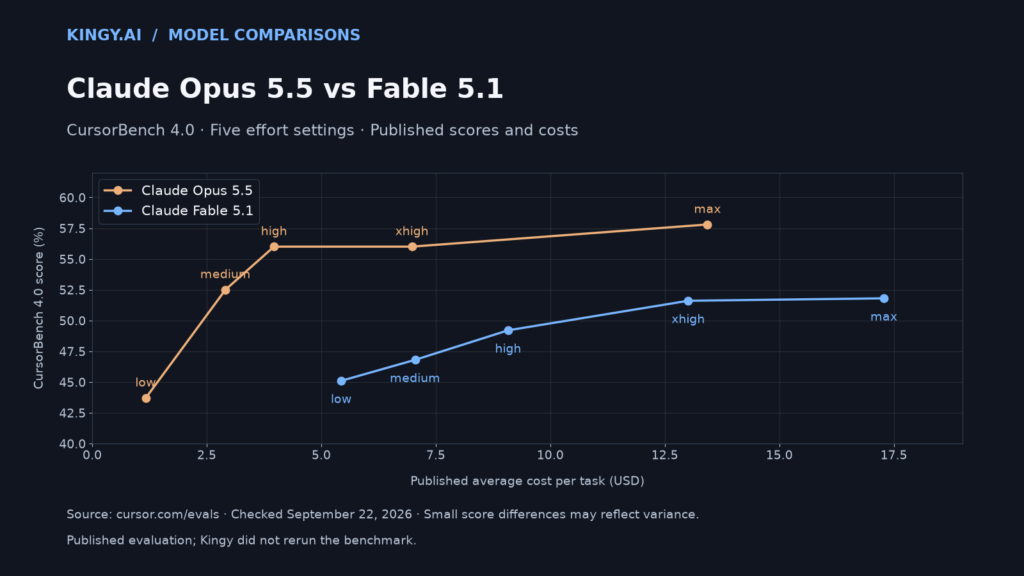
The most useful published example comes from CursorBench 4.0. Opus 5.5 medium scores 52.5% at $2.91 per task. Fable 5.1 max scores 51.8% at $17.28. The score difference is small enough to treat cautiously, but the displayed cost difference is substantial: 1 − ($2.91 ÷ $17.28) = 83.2% less. Cursor’s evaluation table.
That does not mean every Fable job becomes 83% cheaper on Opus. It tells us which configurations deserve attention before we pay the premium. The answer changes with effort, cached context and the kind of work being evaluated.
What changes between the models
| Specification or rate | Claude Opus 5.5 | Claude Fable 5.1 |
|---|---|---|
| Direct API ID | claude-opus-5-5 |
claude-fable-5-1 |
| Context window | 1M tokens | 1M tokens |
| Standard maximum output | 128K tokens | 128K tokens |
| Modalities | Text/images in; text out | Text/images in; text out |
| Adaptive thinking | Always on | Always on |
| Default effort | medium | high |
| Ordinary input per 1M tokens | $4 | $10 |
| Output per 1M tokens | $20 | $50 |
| Cache read per 1M tokens | $0.20 | $0.25 |
| Five-minute cache write per 1M tokens | $5 | $12.50 |
| One-hour cache write per 1M tokens | $8 | $20 |
Sources: Opus 5.5 model reference, Fable 5.1 model reference.
Both support low, medium, high, xhigh and max effort. These are behavioral controls rather than fixed token budgets. The model can change its reasoning, tool use and output at each level. Leaving effort unspecified also gives you different defaults on the two models, so set it explicitly when comparing them. Anthropic’s effort guide, Opus’s current default.
The cache row deserves attention. Opus’s ordinary input and output rates are 40% of Fable’s, but its cache-read rate is 80% of Fable’s: $0.20 ÷ $0.25 = 0.80. A session dominated by cache reads therefore has less room for savings from rates alone. Fable’s generous cache discount does not make its absolute cache-read price lower than Opus’s.
Coding at every effort setting
CursorBench 4.0 reports these scores and average costs. Each cell is score / cost per task.
| Effort | Opus 5.5 | Fable 5.1 |
|---|---|---|
| Low | 43.7% / $1.17 | 45.1% / $5.44 |
| Medium | 52.5% / $2.91 | 46.8% / $7.05 |
| High | 56.0% / $3.97 | 49.2% / $9.08 |
| Xhigh | 56.0% / $6.98 | 51.6% / $13.01 |
| Max | 57.8% / $13.43 | 51.8% / $17.28 |
Source: CursorBench 4.0, read September 22. Cursor evaluates ambiguous, multi-file coding tasks and prices the tokens consumed at published rates. Small score differences may not be statistically meaningful. Methodology.
At low effort, Fable has the higher displayed score by 45.1 − 43.7 = 1.4 points, but costs $5.44 ÷ $1.17 = 4.65 times as much. From medium onward, Opus has both the higher score and the lower cost at each matching label in this table.
The practical starting point is medium or high Opus, rather than an automatic jump to max. Moving Opus from medium to high adds 3.5 points, with ($3.97 − $2.91) ÷ $2.91 = 36.4% more cost. Moving from high to xhigh changes the displayed score by zero, while cost rises by ($6.98 − $3.97) ÷ $3.97 = 75.8%. Max reaches a higher score, but its $13.43 bill is $13.43 ÷ $3.97 = 3.38 times the high-effort bill.
These figures do not prove that xhigh is pointless or that max is wasteful on every coding job. They show why a model’s highest setting should not become your default without considering the task.
Anthropic’s own Terminal-Bench 4.0 curve provides a second view:
| Effort | Opus 5.5 score / cost per attempt | Fable 5.1 score / cost per attempt |
|---|---|---|
| Low | 38.5% / $1.29 | 40.2% / $5.70 |
| Medium | 57.6% / $2.94 | 43.4% / $7.80 |
| High | 64.2% / $3.88 | 49.4% / $10.50 |
| Xhigh | 66.4% / $7.35 | 51.3% / $15.80 |
| Max | 64.8% / $11.24 | 55.8% / $19.50 |
Source: Anthropic’s coding charts.
Opus medium is 1.8 points above Fable max at $2.94 ÷ $19.50 = 15.1% of the displayed cost. The small score gap should not be sold as a conclusive capability win: Anthropic reports a ±2.6-point standard error for its headline Opus result and roughly ±1.6–2 points for the other Claude models. The cost gap is a stronger reason to investigate the cheaper configuration. Benchmark footnotes.
Knowledge work gives Fable a more nuanced comparison
Anthropic’s GDPval-AA v2.1 chart measures professional work using Elo ratings, not task-completion percentages. Here are its displayed ratings and estimated costs:
| Effort | Opus 5.5 Elo / cost per task | Fable 5.1 Elo / cost per task |
|---|---|---|
| Low | 1224 / $0.21 | 1450 / $1.41 |
| Medium | 1576 / $0.86 | 1536 / $2.17 |
| High | 1692 / $1.54 | 1617 / $3.43 |
| Xhigh | 1820 / $4.21 | 1721 / $7.09 |
| Max | 1846 / $8.92 | 1735 / $9.59 |
Source: Anthropic’s knowledge-work chart.
Fable’s low-effort point is 226 Elo above Opus low, which is a reason not to assume the lowest settings are interchangeable. Opus medium, however, reaches 1576 at $0.86, above Fable low’s 1450 at $1.41. That supports comparing across settings as well as matching names.
At the other end, Opus xhigh is 85 Elo above Fable max, at $4.21 ÷ $9.59 = 43.9% of its displayed cost. Opus max extends its own rating by just 1846 − 1820 = 26 Elo, while cost rises by ($8.92 − $4.21) ÷ $4.21 = 111.9%. Elo differences cannot be converted into percentages of jobs saved, so that calculation does not tell you whether the upgrade pays on your documents.
Anthropic also reports a useful long-job example: both models translated HAProxy from C to Rust and passed nearly all of its regression tests. Opus finished in 9.5 hours versus Fable’s 12 and cost 51% less. The elapsed-time reduction is (12 − 9.5) ÷ 12 = 20.8%. This was Anthropic’s internal test, with no complete dollar bill in the launch account, so it remains a case study rather than a universal speed or cost estimate. Anthropic’s coding example.
Work through the bill before switching
The examples below use identical hypothetical token counts. They isolate the rates and include reasoning in billed output. They exclude tools, taxes, regional premiums, Fast mode and discounts. Cache-write tokens replace ordinary-input billing for those tokens; they are not counted in both categories.
1. An ordinary uncached request
Assume 100,000 input tokens and 10,000 output tokens:
- Opus: 0.100 × $4 + 0.010 × $20 = $0.40 + $0.20 = $0.60.
- Fable: 0.100 × $10 + 0.010 × $50 = $1.00 + $0.50 = $1.50.
- Saving: ($1.50 − $0.60) ÷ $1.50 = 60%.
That is the headline rate advantage. Actual jobs may consume different numbers of tokens at different settings.
2. A session with cache writes and repeated reads
Across many requests, assume 200,000 ordinary input tokens, 100,000 five-minute cache-write tokens, 1.8 million cache-read tokens and 150,000 output tokens. The input categories do not overlap:
- Opus: 0.2 × $4 + 0.1 × $5 + 1.8 × $0.20 + 0.15 × $20 = $0.80 + $0.50 + $0.36 + $3 = $4.66.
- Fable: 0.2 × $10 + 0.1 × $12.50 + 1.8 × $0.25 + 0.15 × $50 = $2 + $1.25 + $0.45 + $7.50 = $11.20.
- Saving: ($11.20 − $4.66) ÷ $11.20 = 58.4%.
If those writes use one-hour retention, replace Opus’s $0.50 write charge with 0.1 × $8 = $0.80, for $4.96 total. Replace Fable’s $1.25 with 0.1 × $20 = $2, for $11.95 total. The revised saving is ($11.95 − $4.96) ÷ $11.95 = 58.5%. Opus rate card, Fable rate card, prompt-caching billing.
3. A cache-heavy follow-up
Consider a later request against an already warm cache: 100,000 cache-read tokens, 1,000 new input tokens and 1,000 output tokens.
- Opus: 0.100 × $0.20 + 0.001 × $4 + 0.001 × $20 = $0.020 + $0.004 + $0.020 = $0.044.
- Fable: 0.100 × $0.25 + 0.001 × $10 + 0.001 × $50 = $0.025 + $0.010 + $0.050 = $0.085.
- Saving: ($0.085 − $0.044) ÷ $0.085 = 48.2%.
This follow-up excludes the earlier cache fill. As cache reads dominate more of an otherwise equal bill, the rate saving approaches 20%, because 1 − ($0.20 ÷ $0.25) = 0.20. Opus remains cheaper at the listed rates, but “60% cheaper” becomes an increasingly poor estimate of the session saving.
When Fable can still earn its premium
The reviewed curves make Opus difficult to ignore. They do not show every task, and Anthropic itself says its experience of the Opus–Fable gap is narrower than the headline benchmark margins suggest. Retain Fable where you have evidence that it produces accepted work Opus misses, reduces expensive rework, or preserves an established workflow whose migration cost exceeds the likely saving. A claim that a task is “hard” is not enough on its own.
Using the session example above, Fable costs $11.20 − $4.66 = $6.54 more per equal-token job. If a failed or deficient job costs $50 to repair, Fable would need to prevent more than $6.54 ÷ $50 = 13.08 percentage points of those repair events to repay the premium, assuming everything else is equal. That is a hypothetical break-even calculation; it is not an inferred failure-rate difference from a benchmark.
A cheaper-first policy can also be reasonable when failures are detectable. For 100 jobs at the stipulated session costs, all-Fable costs 100 × $11.20 = $1,120. Running all 100 on Opus and giving 20 a full additional Fable attempt costs 100 × $4.66 + 20 × $11.20 = $466 + $224 = $690. The difference is $430 ÷ $1,120 = 38.4% less. The 20% escalation rate is an assumption, and equal final quality has not been established. Review and handoff costs are extra.
Our cost-per-successful-job guide explains why that final qualification matters.
Switching models has a conversation-history cost
The model ID is only part of the switch. Anthropic’s migration guide says Fable 5.1 can read Opus 5.5 thinking blocks on the Claude API, but Opus 5.5 cannot read Fable’s thinking blocks. Moving an existing Fable conversation to Opus therefore does not preserve all of the model’s reasoning context. Start a fresh task with the relevant files, decisions and requirements when that is practical; do not assume an in-flight downgrade is equivalent to continuing on Fable. Opus migration guide.
Both models already require adaptive thinking and reject forced tool selection. Existing Fable integrations may have handled those constraints, but check the current computer-use tool interface and user-facing progress updates before redirecting traffic. Set effort explicitly and preserve thinking blocks as the API requires. Those integration checks are separate from deciding which model has the stronger benchmark curve. Opus compatibility changes.
Which should you choose?
| Situation | Recommendation |
|---|---|
| New coding workflow | Start with Opus medium; compare high for harder repository tasks. |
| Long coding job with meaningful acceptance checks | Opus high is a strong candidate; reserve xhigh/max for demonstrated gains. |
| Documents, spreadsheets and professional analysis | Start with Opus medium/high; examine xhigh when the more demanding deliverable earns the cost. |
| Existing Fable workflow with a recorded quality advantage | Retain Fable for those tasks and compare the saved rework with its premium. |
| Large, repeated cached context | Calculate the actual token mix; Opus’s rate advantage is smaller than 60% on cache reads. |
| Fable conversation already well under way | Account for thinking-block compatibility before moving the task to Opus. |
I would make Opus 5.5 medium/high the starting shortlist for new work and keep Fable as a selective alternative. The published evidence supports that ordering. It does not establish that Fable has become useless, or that max effort is the right way to compare either model.
For the wider lineup, see our Opus 5.5 launch review, Fable 5.1 review and Astra vs Opus effort comparison.
Sources and limits
CursorBench values come from Cursor’s live table. Terminal-Bench and GDPval values come from Anthropic’s launch charts. We retain the original cost series: Cursor reports Opus medium at $2.91 and xhigh at $6.98, while Anthropic’s CursorBench chart displays $2.90 and $6.99. The differences are small, but silently mixing sources would make the arithmetic harder to reproduce.
Anthropic’s benchmark notes describe production safeguards and fallback models on some evaluations. The configuration is part of the result, not a measurement of an unrestricted standalone model. Vendor case studies, platform evaluations and the hypothetical bills above are labeled separately. No benchmark was rerun for this article, and no missing effort result was invented.