Factory’s redesigned Analytics dashboard gives engineering managers a way to see which models and users consume their coding-agent budget. The October 2 announcement describes views for consumption, model efficiency and adoption, available to Business and Enterprise organizations through Owners and Managers. The charts show where resources went. Deciding whether that spending produced worthwhile software takes another step. Factory announcement
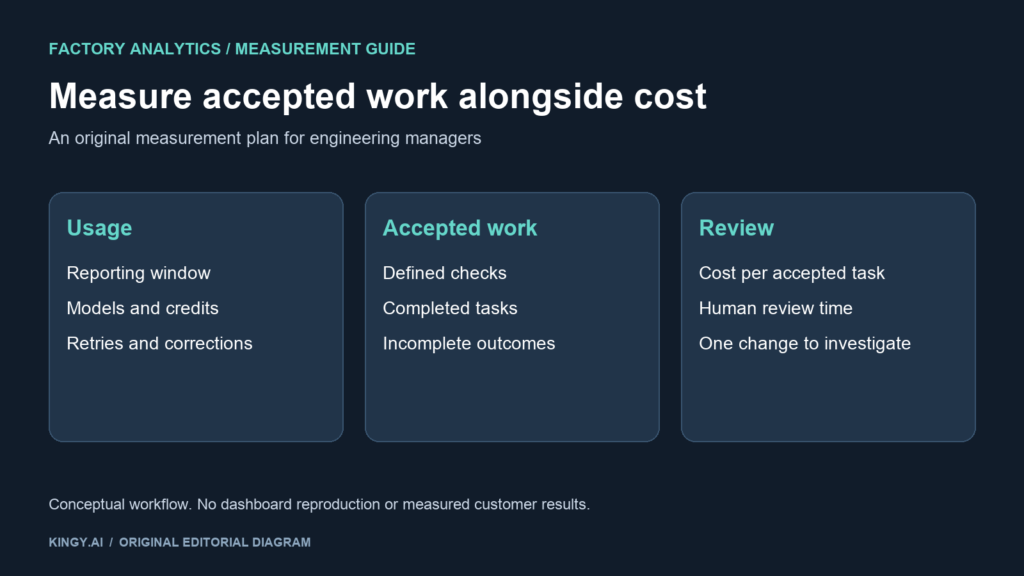
The practical opportunity is to connect agent usage to work that someone accepted. A cheaper session can still leave a developer with more corrections. A more expensive session may complete a difficult migration that would otherwise remain unfinished. The dashboard can help locate those cases; a team needs its own acceptance criteria to judge them.
This is a documentation-based analysis. Kingy has not tested the redesigned dashboard in a customer organization or independently reproduced Factory’s savings figures.
What the new views tell a budget owner
Factory describes consumption by model and user, model-mix and cost-concentration charts, and adoption measures such as active users and sessions. Its announcement also says metric cards include definitions in tooltips. Start with those definitions before comparing teams or reporting a percentage to finance. Dashboard scope and access
For a rollout review, give each chart a specific job. Model mix can prompt an investigation into why routine work uses a costly configuration. Concentration can identify the workloads worth examining first. Adoption can tell you where to ask developers what prevents useful work. None of those observations, on its own, establishes a problem with a particular employee.
A developer handling the hardest repository may legitimately consume more than someone making small documentation changes. An automation may serve an entire team through one identity. Before setting a restriction, inspect the tasks behind the usage and ask who benefits from the output.
A useful weekly review starts with one concrete question: which repeated task consumes enough resources that improving it would matter? Choose a task you can recognize in the work tracker, such as fixing one class of failing tests. “People using AI” is too broad a comparison group.
Read the Router baseline before repeating the percentage
The new dashboard includes estimated Router savings. Factory’s Router page reports 63% aggregate cost savings for production sessions from September 5–18, 2026, comparing billed usage with the same work priced at frontier-model rates. It also reports a 72.5% median session saving. These are vendor-reported comparisons with different denominators, rather than an independent guarantee for your next project. Factory Router figures and comparison period
A median describes the middle session in the ranked sample. The aggregate describes the combined cost comparison. A few expensive sessions can affect the aggregate substantially without moving the middle session very much. Keep the two measures separate when evaluating a rollout.
The counterfactual matters too. A comparison against frontier-model pricing answers a different question from a comparison against your team’s previous setup. If developers already selected inexpensive models for easy tasks, their incremental saving could be smaller. If the rollout changes the difficulty or volume of work, a before-and-after total needs that context.
Ask for the measured period, the included workloads, the comparison configuration and the treatment of incomplete work. A chart labeled “savings” should not acquire a broader meaning as it moves from a product screen to a budget presentation.
Calculate cost per accepted task
Here is a hypothetical example using standardized cost units, not Factory prices, customer data or a measured product result. Both approaches attempt 100 tasks of comparable difficulty. A reviewer accepts a task only after its defined checks pass.
| Measure | Approach A | Approach B |
|---|---|---|
| Tasks attempted | 100 | 100 |
| Total cost units | 1,000 | 600 |
| Tasks accepted | 80 | 40 |
| Cost per accepted task | 12.5 | 15 |
Approach B consumes 40% fewer units, but costs 20% more per accepted task. The calculation is 1,000 ÷ 80 = 12.5 and 600 ÷ 40 = 15. The smaller bill becomes a worse result when the accepted-work denominator falls far enough.
That example does not predict how Router performs. It shows why a team should retain both usage and outcome evidence. Record unfinished tasks, retries and corrections alongside the completed ones. If no tasks qualify, report cost per accepted task as unavailable and keep the total cost visible.
Track human review time separately. Ten minutes fixing generated code and ten minutes checking already correct code consume the same clock time but describe different work. For a first evaluation, a short reason code and the acceptance result may be more useful than a complicated productivity score.
The API has different access and timing boundaries
Factory’s Analytics API documentation requires Manager or Owner access for organization endpoints. Its personal cost endpoint is self-scoped and requires an Enterprise organization with Analytics enabled. Dates use UTC; data is available through yesterday, and a request for today returns an error. The documented billable_tokens field represents Factory Standard Credits rather than a simple raw-token total. Analytics API permissions, units and date limits
Do not assume dashboard access automatically grants every API capability. Check your role and organization entitlement before designing an export around it. Likewise, a report that excludes the current UTC day should not be presented as a complete live spending total.
For your own comparison sheet, retain the query dates, unit definition and retrieval time beside the figures. Use the same window for usage and accepted tasks. If a task finishes after the reporting window, choose a consistent rule for assigning its costs and outcome; otherwise, a long-running job can appear expensive in one week and productive in the next.
Hosted analytics and your telemetry collector are separate surfaces
Factory documents hosted Analytics alongside customer OpenTelemetry export. The customer export is metrics-only by default; token and cost estimates belong to the hosted API rather than the customer OTEL metric set. Review that distinction before expecting an existing observability dashboard to reproduce the hosted cost report. Telemetry and hosted analytics
The telemetry privacy documentation describes aggregate granularity and optional message-content export. Content export is off by default; when enabled for a customer collector, it is raw and has no automatic secret detection or personal-data scrubbing. These are documented export controls, not a blanket claim about every Factory data flow. Telemetry privacy boundaries
Decide who needs individual-level detail before collecting more of it. A team trying to locate repeated expensive workflows may be able to answer that question with workload-level comparisons and voluntary developer feedback. Keep raw content out of the measurement plan unless it serves a specific, approved purpose.
A small rollout review you can finish
Pick one repository and one recurring task class. Define acceptance first, then keep the model configuration, attempted tasks, usage window, accepted results and review time together. Review failures as well as successes. Change one variable at a time so that a better prompt, a different model and a new task mix do not become one indistinguishable “AI improvement.”
For adjacent decision-cost analysis, see Kingy’s Clef versus Clef-flash evaluation guide. For a separate enterprise-agent rollout example, see the OpenClaw Enterprise pilot analysis.
After the first review, choose one concrete change to investigate: a repeated retry, an unnecessary model escalation, or a task whose acceptance criteria are unclear. Preserve the original comparison window and check whether that change improves accepted work as well as consumption.
The Kingy Brief
Get future Kingy Brief editions.
Source-checked AI changes, original tests and one practical thing to try.
Free · Choose your subjects · Double opt-in · Unsubscribe anytime
Regular sending is paused; no restart date is set.