
Google’s Gemini 4 Carbon has taken the top spot on Artificial Analysis’s newly revised Intelligence Index. The independent evaluator scores Carbon High at 59, one point ahead of Claude Opus 5.5 Max with default fallbacks and two ahead of GPT-6 Astra Max. That is a striking debut, but the numbers are rounded scores on a particular collection of tests, not a guarantee that Carbon is the best model for every job.
There’s a more immediate limitation: most people cannot yet use it. Google says access starts this week with selected cyber defenders and gradually more Fairwind partners. Wider developer, business and consumer access has no announced date. Carbon’s introductory API rate is $2 per million input tokens and $10 per million output tokens, before an undated increase to $4/$20. Announced prices do not establish public API availability.
Carbon also has strong competition in individual tests. Opus leads it in the computer-use result on Google’s chart, GPT-6 Astra and Opus both score higher on FrontierSWE2, and an independent professional-work index puts Claude Sonnet 5.5 marginally ahead. Those exceptions matter if you’re choosing a model to run a coding agent, prepare financial documents or operate software, rather than shopping for a leaderboard position.
We have not tested Carbon ourselves. This guide separates Google’s reported results from independent evaluations and uses information available on October 28, 2026. Evaluations, prices and access can change during rollout.
Image credit: Google / Google DeepMind, official Gemini 4 Carbon launch artwork.
What is Gemini 4 Carbon?
Carbon follows Gemini 4 Argon in Google’s proprietary model family. Its launch benchmarks cover software engineering, science, long-context retrieval, computer use and cybersecurity. The model’s position in the Gemini family matters less to a buyer than the tools and terms eventually exposed. A purchasing decision requires knowing which version a service supplies, what it can access, how it handles failures and what the customer must review.
Independent evaluator Artificial Analysis lists a one-million-token context window, text, image, speech and video inputs, and text output. Vals also lists a one-million-token context. These are evaluator listings; we have not located a new Carbon-specific Google developer specification establishing the final public API contract. In particular, a large input window does not mean the model generates video or audio, and Vals’s maximum-output metadata should not be mistaken for a confirmed Google API limit.
| Property | What is known |
|---|---|
| Context window | 1 million tokens, listed by Artificial Analysis and Vals |
| Inputs | Text, image, speech and video, listed by Artificial Analysis |
| Output | Text, listed by Artificial Analysis; Google API maximum output is not confirmed |
| Parameters and architecture | Not disclosed in the Carbon-specific sources reviewed |
| Knowledge cutoff | Not established in the Carbon-specific sources reviewed |
| Weights | Proprietary; no downloadable Carbon weights found |
| Availability | Initially selected cyber defenders and progressively more Fairwind partners; wider release date unannounced |
Google has not established a Carbon-specific public parameter count, architecture, training-compute figure or knowledge cutoff in the sources reviewed. Nor should readers assume an endpoint name, region list or rate limit from earlier Gemini models. Carbon weights are not available for download. If those details are central to a deployment, wait for the actual model documentation and test the version offered under your agreement.
A million-token window is useful when a job needs a large codebase, long document or collection of files in one request. It does not make every token equally easy to retrieve, nor does it tell you the cost of repeated agent steps. Context capacity, retrieval accuracy and the number of requests an agent makes are different properties.
The independent benchmark lead, explained
Artificial Analysis’s Intelligence Index v5.0 methodology combines nine evaluations across Knowledge Work, Coding, Science and General. Each of those four groups contributes 25% to the aggregate. Its tests use different datasets, tools and grading methods; the published index describes the specific configurations it evaluates. Carbon’s headline entry uses its High reasoning setting.
| Model and evaluated configuration | Index score | Price context |
|---|---|---|
| Gemini 4 Carbon High | 59 | Standard $4 input / $20 output per million tokens |
| Claude Opus 5.5 Max, default fallbacks | 58 | $4 / $20 |
| GPT-6 Astra Max | 57 | $10 / $50 |
| GPT-6.1 Sol Max | 55 | $2 / $10 |
| DeepSeek V4.1 Flash 1017 Max | 32 | Provider rates vary by time |
| GLM-5.3 Max | 32 | Hosting or provider cost varies |
Sources: Artificial Analysis leaderboard, v5 announcement, Google pricing, OpenAI models, Claude pricing and DeepSeek pricing. Scores are rounded; prices are US dollars per million input and output tokens, before caching or other conditions.
The one-point gap over Opus is a reason to pay attention, not a demonstrated statistically significant advantage on every task. Carbon’s result is also from v5.0, which Artificial Analysis introduced on October 27. The evaluation mix changed from v4.3, so an old v4.3 score and Carbon’s 59 cannot be treated as points on the same unchanged scale. A cached model page with an older score can be misleading. For example, the v5 announcement lists Kimi K3.1 Pro at 46; it does not show that Kimi suddenly lost the capabilities measured under the previous index.
This distinction is especially useful when comparing released-weight models. DeepSeek V4.1 Flash 1017 and GLM-5.3 are downloadable models, and both score 32 in the v5 announcement. That is a substantial aggregate gap to Carbon under this particular suite. It does not settle the economics of a private deployment, the performance of a tuned system, or the value of controlling the weights. Artificial Analysis says Kimi K3.1 Pro’s weights had not been released at the time of its announcement, so its API results should not be sold as a downloadable-weight comparison.
The v5 methodology matters because an aggregate can conceal a poor fit. A research group may care about scientific reasoning; a company building a browser agent may care more about actual interaction with its software. Both can start with the same index and end up choosing different models.
Google’s results show both strengths and exceptions
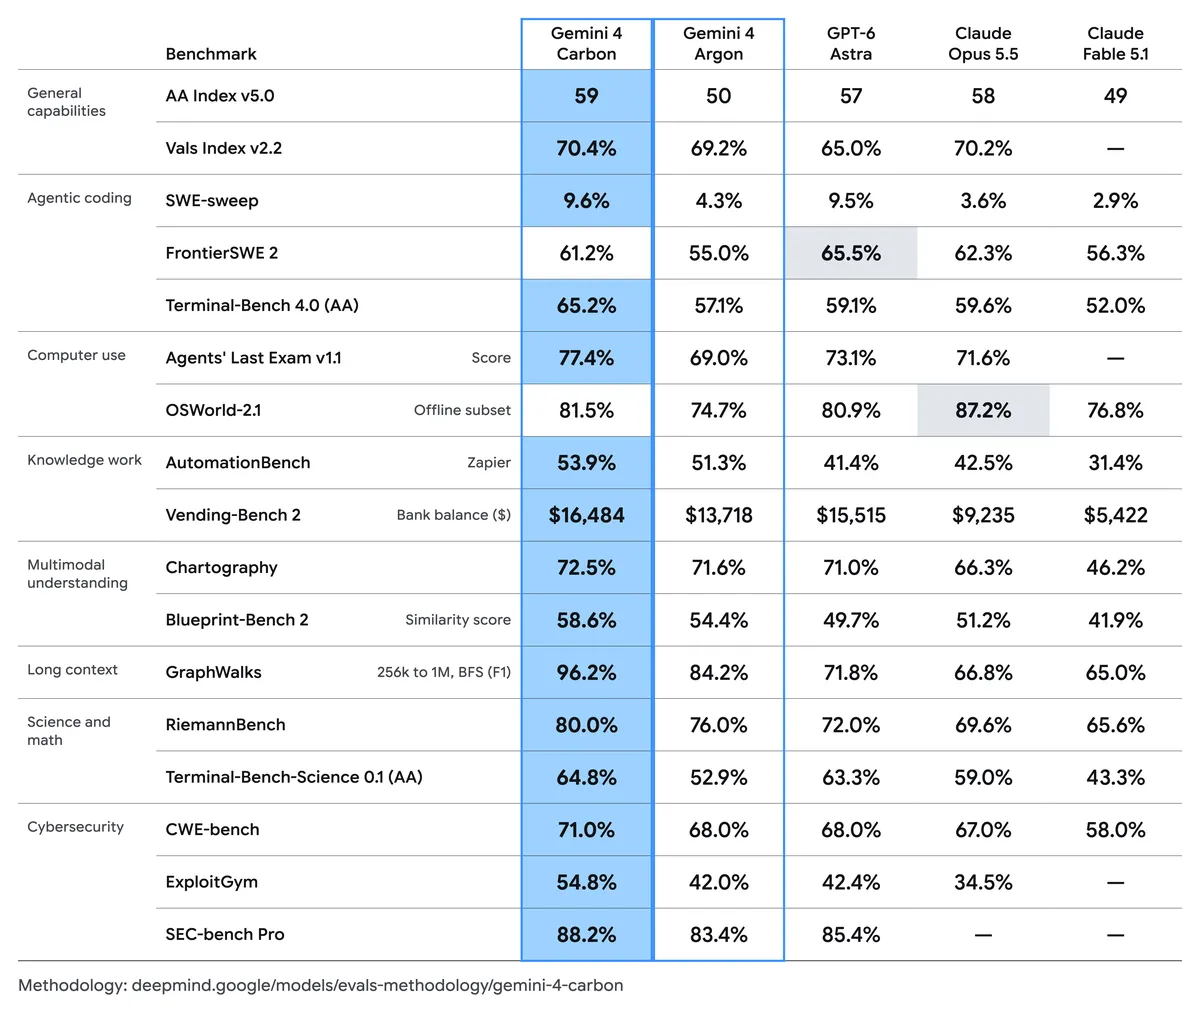
Google’s launch chart combines its own runs with results from outside evaluators. It is useful as a map of the claims, provided each row keeps its own setup. The following selection includes cases where Carbon trails a rival as well as cases where it leads. Values are those shown in Google’s chart; the evaluation methodology describes configurations and exceptions.
| Evaluation | Carbon | Argon | GPT-6 Astra | Claude Opus 5.5 |
|---|---|---|---|---|
| FrontierSWE2 | 61.2% | 55.0% | 65.5% | 62.3% |
| Terminal-Bench 4.0, Artificial Analysis | 65.2% | 57.1% | 59.1% | 59.6% |
| SWE-sweep | 9.6% | 4.3% | 9.5% | 3.6% |
| OSWorld 2.1 offline subset | 81.5% | 74.7% | 80.9% | 87.2% |
| GraphWalks, 256K–1M BFS F1 | 96.2% | 84.2% | 71.8% | 66.8% |
| CWE-bench | 71.0% | 68.0% | 68.0% | 67.0% |
These rows are not a single independent head-to-head trial. Google’s methodology identifies Artificial Analysis and Vals as external sources, while Google computed the GraphWalks results and ran Carbon on SWE-sweep using its mini-swe-agent setup. CWE-bench results compare model and agent combinations. Google generally uses its highest thinking setting and cites competitors’ highest available reasoning results, with benchmark-specific exceptions. The meaning of a point changes with the task and its scoring.
FrontierSWE2 is the clearest counterexample to a blanket claim that Carbon wins coding. Astra scores 65.5% and Opus 62.3%, ahead of Carbon’s 61.2% in the chart. Carbon does lead the listed Terminal-Bench 4.0 result. Both findings can be true because software tasks differ: terminal work, repository repair, agent tooling and available time do not measure identical skills.
SWE-sweep is especially easy to misread. Its benchmark owner describes an agent searching a codebase for bugs without the usual issue description or bug location, then attempting a repair checked against hidden tests and existing tests. Carbon’s 9.6% is fractionally above Astra’s 9.5% in the launch chart. It also means the measured system did not resolve the large majority of the benchmark’s reference bugs. The score is not a 96% coding accuracy figure, and a tenth of a point is a narrow observed difference.
OSWorld tests computer use, but Google’s 81.5% is for an 82-task offline subset, scored with partial credit and the maximum of three runs, using screenshot-only observations and an updated Gemini computer-use harness. It is not the average of ordinary one-shot interactions across the full dataset. Under the displayed setup Opus’s 87.2% is higher. If your agent must click through a business application, that difference invites a closer test of the actual interface, authentication, recovery and permissions rather than a prediction about your own success rate.
GraphWalks tests a different kind of long-context work: traversing information in a graph represented within a large prompt. Carbon’s 96.2% F1 over the stated 256K–1M range is a strong Google-computed result, and its 12-percentage-point lead over Argon is worth investigating. F1 is a task-specific measure, not a promise that Carbon will accurately find every clause in a million-token contract. Put representative documents and known answers into a private evaluation before relying on the model for retrieval.
Coding agents: model plus tools, not model alone
Artificial Analysis also runs a separate Coding Agent Index. There, Carbon High with Antigravity CLI scores 59, behind Opus Max with Claude Code at 62. That comparison is valuable precisely because it includes the surrounding agent. A coding agent’s instructions, tool access, retry behavior and execution environment can change what it accomplishes.
Don’t mix that index’s figures into the Intelligence Index components. The coding-agent analysis uses FrontierCode 1.1, whereas the v5 Intelligence Index uses FrontierCode 2.0. Even similarly named terminal results can reflect separate runs and configurations. A model vendor’s launch score is not interchangeable with an independent evaluator’s score merely because the benchmark name matches.
For its Intelligence Index suite, Artificial Analysis reports a $7.76 task cost for Carbon using the standard $4/$20 price, compared with $10.04 for Opus Max and about $6.24 for Astra Max. These are Intelligence Index costs, not costs from the separate Coding Agent Index. On those figures Carbon is roughly 23% cheaper than Opus and 24% more expensive than Astra for that suite. That result incorporates the tested trajectories; it is not a general production quote. A cheaper input token can be outweighed by longer reasoning, extra tool calls or repeated failed attempts.
For an engineering team, the useful next step after access arrives is a small trial on a representative set of issues with tests and human review. Record completion, regressions, wall-clock time and total billable cost. Include difficult failures and abandoned runs. A model that wins a public benchmark but repeatedly needs a developer to repair its output may be the expensive choice for your own repository.
What independent professional and web tests say
Vals’s Index v2.2 tests professional tasks across finance, coding, legal and tax. Its Carbon page reports 70.36 ± 0.97, compared with point estimates of 70.85 for Sonnet 5.5 and 70.18 for Opus 5.5 in the observed snapshot. The uncertainty interval overlaps those neighboring estimates, so the order should not be read as a decisive overall win for any of the three. The aggregate index page carries an October 27 date while including Carbon; its model page explicitly dates the Carbon evaluation October 28. We use the observed October 28 results.
Vals’s individual Carbon scores include 55.77% on Legal Research, 66.35% on Finance Index and 63.13% on Terminal-Bench 4.0. That last number differs from Artificial Analysis’s 65.2% result. Different evaluation operators can use different settings and samples; averaging the numbers would not create a more authoritative score. For professional work, the critical questions also include citation accuracy, review time and the cost of an undetected error, none of which a single overall rank can fully answer.
The WebDev Arena leaderboard offers another perspective: blind preferences on generated web work. Its observed Carbon High score is 1768 ± 15, based on 2,230 votes, with a preliminary rank of fourth and a reported rank spread of two to six. Opus Max leads the snapshot at 1810 ± 13; Astra Max and Sonnet xHigh sit close to Carbon. This is a promising early signal, not a settled fourth-place ranking or proof of production-ready frontend code. Visual preference also does not establish accessibility, security, performance or maintainability.
Pricing: introductory rates, standard rates and real bills
The introductory and standard Carbon rates appear below. Artificial Analysis independently records the 50% launch discount and a 95% reduction for cached input, with no confirmed end date. The cached prices are calculated from those discounts. Treat these as announced rollout rates and check the actual service terms before committing a budget.
| Model and rate | Input | Cached input | Output | Conditions |
|---|---|---|---|---|
| Carbon introductory | $2 | $0.10 | $10 | Announced; restricted rollout, no expiry announced |
| Carbon standard | $4 | $0.20 | $20 | Announced post-intro rates; cached rate calculated from 95% discount |
| GPT-6 Astra | $10 | See provider terms | $50 | Standard rates |
| GPT-6.1 Sol | $2 | See provider terms | $10 | Standard rates |
| GPT-6.1 Terra | $1 | $0.05 | $5 | Higher full-request rates above 272K input tokens |
| Claude Opus 5.5 | $4 | $0.20 | $20 | Cache writes and retention billed separately |
| Claude Sonnet 5.5 | $2 | $0.10 | $10 | Cache writes and retention billed separately |
| DeepSeek V4.1 Flash 1017, peak | $0.30 | $0.006 | $1.20 | Time-dependent; separate tool fees may apply |
| DeepSeek V4.1 Flash 1017, off-peak | $0.15 | $0.003 | $0.60 | Time-dependent; separate tool fees may apply |
DeepSeek defines peak as weekdays 01:00–04:00 and 06:00–10:00 UTC, excluding Chinese holidays; other hours, including weekends and Chinese holidays, are off-peak. Verify the current DeepSeek schedule and tool fees before estimating a bill. Rates shown are base token rates; billing of reasoning, caching, tools and special modes depends on the provider’s contract.
Carbon’s standard base rate matches Opus 5.5; its introductory rate matches Sonnet 5.5 and GPT-6.1 Sol. Cache writes, retention, tool charges, rate limits and special modes can still differ. Claude’s current documentation lists Sonnet cached reads at $0.10 per million, with separate cache-write charges. DeepSeek’s token rates are far lower, although its capabilities and the work needed to review its output also belong in the comparison.
Here’s a deliberately simple calculation. Suppose one request uses 100,000 uncached input tokens and 10,000 billable output tokens, including any reasoning tokens billed as output. At Carbon’s introductory rates, the input costs $0.20 and the output $0.10, for $0.30. At the announced standard rates, the same token counts cost $0.60. If reasoning or other billable output adds tokens beyond the 10,000, the bill increases. This example excludes cache writes, storage, tools, taxes and special modes; it is arithmetic, not a measured task cost.
Real systems rarely hold token counts constant across models. A model can use fewer tokens, call tools more often, retry a task or take a longer reasoning path. Cached prefixes may reduce input costs, but creating and maintaining a cache can carry its own terms. Compare total cost per reviewed, successful task, and track the failures as well as the successes.
Terra offers a useful lower-price comparison for workloads where its capabilities are sufficient. Its model page lists $1 input, $0.05 cached input and $5 output per million at standard rates. For requests above 272,000 input tokens, it applies 2× input and cached-input rates and 1.5× output rates to the full request. That threshold matters when comparing large-context jobs. Our GPT-6.1 Terra guide covers that model separately.
Claude, OpenAI and open-weight alternatives
Anthropic’s documented lineup includes Opus 5.5, Sonnet 5.5, Haiku 5.5 and Fable 5.1. Fable 5.1 is the model in Google’s Carbon chart; the primary material reviewed does not establish a released Fable 5.5. Opus’s strong computer-use and coding-agent results make it a serious alternative, while Sonnet’s Vals result and lower headline price make it relevant to professional workflows. Anthropic’s fallback behavior can affect some evaluated requests, so keep the published configuration attached to the score. See Anthropic’s current model overview and Opus announcement for the model and configuration details.
OpenAI’s current catalog positions GPT-6 Astra as its top capability model, Sol as a balance of price and capability, and Terra as an efficient model for visual reasoning and computer use. Astra’s stronger FrontierSWE2 score and lower cost in Artificial Analysis’s Intelligence Index task-cost comparison show why the highest aggregate index score does not settle every purchase. Check the exact model, reasoning setting and product terms when comparing results: an API model, a chat plan and an agent harness are not interchangeable.
For teams that need to run a model themselves, DeepSeek V4.1 Flash 1017 weights are published under the MIT license, and GLM-5.3 weights are published under their own GLM-5.3 license. Read the license for the exact model before deployment; a family name alone does not establish the terms for every version. Downloadable weights give an operator more control over infrastructure and customization, but hardware, hosting, maintenance, security and evaluation still cost money. DeepSeek also publishes an API with peak and off-peak rates, separate from the cost of self-hosting.
Cyber capability and safety claims need context
The launch chart reports Carbon at 71.0% on CWE-bench, 54.8% on ExploitGym and 88.2% on SEC-bench Pro. These are cybersecurity evaluations with distinct tasks and setups. Google says the cyber benchmarks were evaluated without guardrails, a condition that matters when comparing them with a deployed product. Google’s methodology identifies Antigravity as its ExploitGym and SEC-bench Pro harness and takes those competitor figures from rival reports. Its SEC-bench result covers the 183-task May JavaScript-engine split, not the owner’s entire current leaderboard.
CWE-bench assesses an agent’s ability to find and patch vulnerabilities while preserving the original functionality. Its results compare Carbon with Antigravity, Astra with Codex and Opus with Claude Code. Those scores reflect both the model and the agent configuration. ExploitGym covers exploit-development tasks, and SEC-bench Pro examines security work in real software contexts. Strong results can help defenders investigate and repair flaws; the same underlying capabilities also have obvious dual-use implications. Benchmark performance alone does not tell us how well a publicly released product will manage misuse.
Google reports internal alignment improvements, 0.0% successful cheating on its evaluated Terminal-Bench set and 0.0% attack success on Gray Swan’s prompt-injection benchmark. These test results cannot establish universal resistance. We did not obtain an independent Carbon-specific Gray Swan replication. Participation in voluntary US pre-release testing does not amount to government certification.
Artificial Analysis’s Omniscience v1.1 results provide a useful counterpoint. Carbon scores 54 overall and correctly answers 58% of all questions, while its reported hallucination rate rises to 11% from Argon’s 4%. The evaluator’s denominator is incorrect responses divided by all non-correct responses, including partial answers and abstentions. The correct-answer share of the whole question set is therefore 58%; the accessible results do not give a separate Carbon attempted-answer rate, so we cannot establish how many of the rest were partial answers or abstentions. That missing breakdown limits interpretation. The 11% is neither the proportion of every response that is wrong nor a measurement of sourced web research.
The safety report linked from Google’s launch is titled and written for Gemini 4 Argon. It provides background on Google’s safeguards, but it is not a full Carbon-specific safety report. Until a Carbon-specific report and independent testing of the released safeguards are available, buyers should treat the safety claims as evidence with a defined scope, not an assurance about every deployment.
Who should wait, and what to test when access opens
The launch chart also gives a glimpse of work beyond software engineering. On the launch chart’s Artificial Analysis Terminal-Bench-Science 0.1 row, Carbon scores 64.8% against Astra’s 63.3% and Opus’s 59.0%. Google also reports a 72.5% Chartography result for Carbon, compared with 71.0% for Astra and 66.3% for Opus. These are different evaluations, and the chart’s Chartography setup uses no tools. They suggest where to investigate, not how accurately the model will interpret your own scientific data or charts.
Once documentation and wider access arrive, compare the released model on examples with known answers, including failures and total cost. Check its output limit, regional availability, data handling, rate limits and billing terms before relying on it in production.
Primary sources and further reading
- Google: Introducing Gemini 4 Carbon and evaluation methodology
- Artificial Analysis Intelligence Index v5.0 and benchmarking methodology
- Vals Carbon results and Vals Index
- WebDev Arena leaderboard
- OpenAI model catalog, Claude model overview, and DeepSeek API pricing
The Kingy Brief
Get The Kingy Brief.
AI changes, original tests and one practical thing to try. Fridays at 09:00 Vancouver time.
Free · Double opt-in · Unsubscribe anytime
Sign up for The Kingy Brief on Beehiiv.
Signup help and newsletter schedule
Signup form provided by Beehiiv. After submitting, check your inbox for "Confirm your subscription to The Kingy Brief" and open its confirmation link. Check Spam or Promotions if you cannot find it.
Fridays at 09:00 Vancouver time: source-checked AI changes, original tests and one practical thing to try. We skip a week when there is not enough verified material. Free. Unsubscribe anytime.