Wave One · July 2026

Kingy AI Referral Index

Published estimates of how much traffic AI assistants actually send disagree by more than an order of magnitude. This index catalogues the primary studies, explains where the disagreement comes from, and publishes the ranges that survive reconciliation.

Methodology v1.0

1.3%of kingy.ai's own traffic came from AI assistants — 20–26 July 2026, seven complete days. See our books.

Records last checked 2026-07-28. Every record is re-checked against its primary source each wave; anything unchecked for two waves is marked.

The one chart

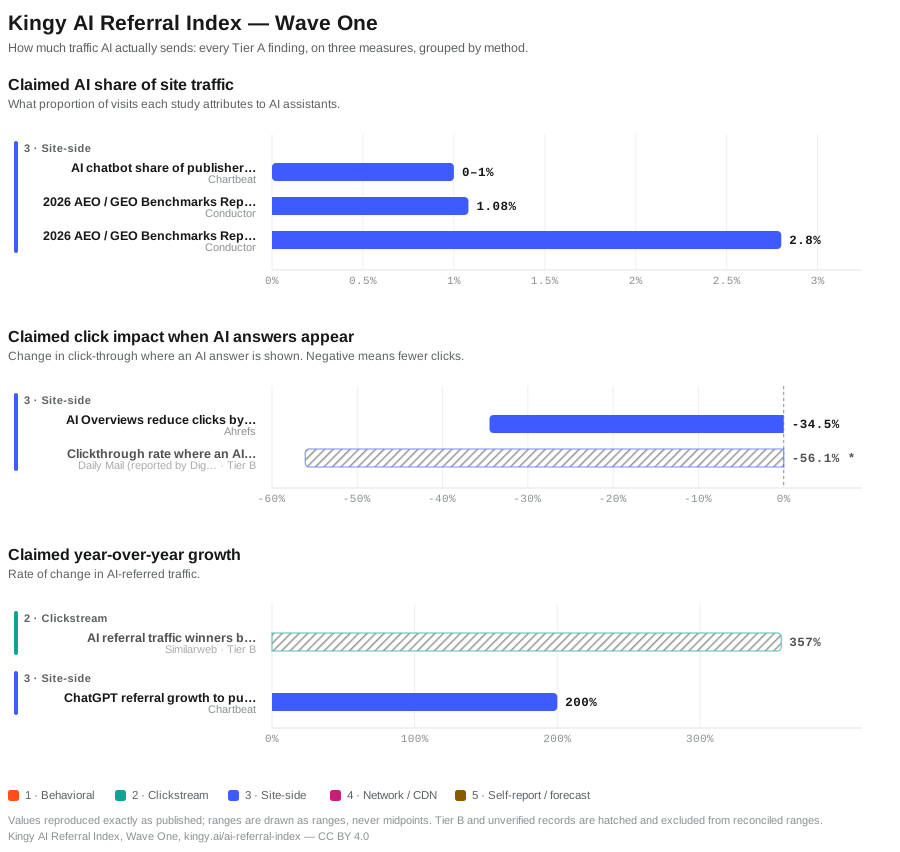
Every Tier A finding, on three measures, grouped by how it was measured. A study that published a range is drawn as a range — none of these values has been restated, rounded or converted to a midpoint.

Claimed AI share of site traffic

What proportion of visits each study attributes to AI assistants.

Claimed AI share of site trafficWhat proportion of visits each study attributes to AI assistants. 3 studies plotted. Full values are listed in the study catalog table below.0%0.5%1%1.5%2%2.5%3%3 · Site-sideChartbeat — AI chatbot share of publisher pageviews Published: less than 1% 3 · Site-sideAI chatbot share of publisher…Chartbeat0–1%Conductor — 2026 AEO / GEO Benchmarks Report — all industries Published: 1.08% 3 · Site-side2026 AEO / GEO Benchmarks Rep…Conductor1.08%Conductor — 2026 AEO / GEO Benchmarks Report — Information Technology Published: 2.80% 3 · Site-side2026 AEO / GEO Benchmarks Rep…Conductor2.8%
Claimed click impact when AI answers appear

Change in click-through where an AI answer is shown. Negative means fewer clicks.

Claimed click impact when AI answers appearChange in click-through where an AI answer is shown. Negative means fewer clicks. 2 studies plotted. Full values are listed in the study catalog table below.-60%-50%-40%-30%-20%-10%0%3 · Site-sideAhrefs — AI Overviews reduce clicks by 34.5% Published: -34.5% 3 · Site-sideAI Overviews reduce clicks by…Ahrefs-34.5%Daily Mail (reported by Digital Content Next) — Clickthrough rate where an AI Overview appears Published: 56.1% lower on desktop 3 · Site-side Tier B — quarantined, excluded from reconciled ranges Pending primary verificationClickthrough rate where an AI…Daily Mail (reported by Dig… · Tier B-56.1% *
Claimed year-over-year growth

Rate of change in AI-referred traffic.

Claimed year-over-year growthRate of change in AI-referred traffic. 2 studies plotted. Full values are listed in the study catalog table below.0%100%200%300%2 · ClickstreamSimilarweb — AI referral traffic winners by industry Published: 357% 2 · Clickstream Tier B — quarantined, excluded from reconciled rangesAI referral traffic winners b…Similarweb · Tier B357%3 · Site-sideChartbeat — ChatGPT referral growth to publishers Published: more than 200% 3 · Site-sideChatGPT referral growth to pu…Chartbeat200%
  • 1 · Behavioral
  • 2 · Clickstream
  • 3 · Site-side
  • 4 · Network / CDN
  • 5 · Self-report / forecast
  • Tier B or pending verification — excluded from reconciled ranges

1 record is listed in the catalog but not plotted, because the published value could not be read as a number in this panel's unit without restating it. Restating it is what this index exists to avoid. Those rows are marked in the table.

Download this chart: SVG · PNG — reuse permitted under CC BY 4.0 with attribution to Kingy AI.

Reconciled ranges

Where the Tier A studies actually agree, once the Seven Deltas are accounted for. Tier B records and anything pending primary verification are excluded from these figures.

Publishers & news

Under 1%

If you cite one number: <1% of total pageviews — Chartbeat network, Dec 2024 – Dec 2025.

Based on 2 Tier A studies across 1 measurement method.

Single-method evidence — treat as one study with error bars, not a reconciliation.

One Tier A study, one measurement method, so this is a reading rather than a reconciliation. It is corroborated in direction by the cross-industry figures (Conductor: 1.08% of all traffic) but not independently confirmed for publishers. A second method — a panel or a network-level measurement of news sites — is what would turn this into a range.

B2B & tech

2.8%

If you cite one number: 2.8% of all website traffic for IT-industry domains — Conductor, May – Sep 2025.

Based on 1 Tier A study across 1 measurement method.

Single-method evidence — treat as one study with error bars, not a reconciliation.

One Tier A study, one measurement method. Read it as an industry premium rather than a web-wide rate: the same study, same method and same dataset puts all industries at 1.08% and Communication Services at 0.25%. The sample is enterprise domains, which are not a random sample of the web.

Retail & commerce

No figure

Not enough Tier A evidence to reconcile this category yet.

Wave One publishes no figure for retail. The widely quoted growth numbers for this category all trace back to a single vendor's analytics, and we could not reach that primary source to verify sample, window and denominator. We would rather show a gap than repeat a figure we have not read at source — that is the same standard we apply to everyone else in the catalogue. This is the first gap Wave Two will try to close.

Our own books

An index that grades other people's measurement should show its own. These are kingy.ai's figures, measured the same way we ask of everyone else — and they are deliberately kept out of the reconciled ranges above, because we curate those.

Monthly AI-referral share
1.3%
Crawl-to-refer ratio
678 : 1

Measurement window: 20–26 July 2026, seven complete days.

Referred pageviews from Koko Analytics, a cookieless first-party counter, filtered to a named list of assistant hostnames (chatgpt.com, claude.ai, gemini.google.com, perplexity.ai, copilot.microsoft.com, notebooklm.google.com, poe.com, chat.mistral.ai, chat.qwen.ai, doubao.com and their sub-hosts). Crawler requests from raw Apache access logs, filtered to a named list of AI crawler user agents (GPTBot, OAI-SearchBot, ChatGPT-User, ClaudeBot, Claude-User, anthropic-ai, PerplexityBot, Bytespider, meta-externalagent, Amazonbot, CCBot, DuckAssistBot, YouBot, cohere-ai, MistralAI-User) and to page requests only, excluding images, CSS, JavaScript and feeds. 88 AI-referred pageviews against 6,627 total; 59,643 AI-crawler page requests over the same seven days. The trailing twelve months to 30 June 2026 give 2,325 of 174,993 — 1.33% — so the weekly figure is not an artefact of the window.

Two asymmetries work against reading the ratio naively, and both cut against us. Our pageview counter is a JavaScript beacon, so it undercounts readers running blockers, while crawlers are counted server-side and cannot be undercounted — the true ratio is therefore lower than 678:1. And any assistant that strips the referrer header is invisible in the numerator, which is the same dark-traffic problem this index documents in other people's figures; our own share is a floor, not a point. Crawler identification is user-agent based and not reverse-DNS verified, so a spoofed agent would be counted. We publish the ratio because the direction is unambiguous even after those corrections, not because the number is precise.

The Seven Deltas

Published estimates of AI referral traffic disagree by more than an order of magnitude. They are not all wrong. Most of the spread resolves into seven recurring differences in what was measured.

  1. 1 Dark traffic

    An assistant that sends a visitor without a referrer header is invisible to almost every method here. Cloudflare says so plainly about its own figures: traffic referred by Claude's native app carries no referrer, and it believes the same holds for other native apps, so its ratios "may overstate the respective ratios, but it is unclear by how much." Chartbeat makes the same point from the publisher side, noting that dark social is harder to attribute. The practical consequence is that nearly every AI-referral share you will read, including ours, is a floor rather than an estimate — and nobody can currently say how far off the floor sits.

    #dark-traffic-delta

  2. 2 The denominator

    Share of what? Conductor's 1.08% is a share of all website traffic. Chartbeat's "less than 1%" is a share of total pageviews. A share of referred traffic — visits that arrived from any external link — is a much smaller denominator and produces a much larger number from identical data. Our own books show the size of the effect: the same week is 1.3% of pageviews and 2.8% of referred traffic. Neither is wrong; they answer different questions. Most published figures do not say which question they answered, which is why this index records a denominator note on every record.

    #denominator-delta

  3. 3 The measurement window

    The studies here cover windows of one week, five months and thirteen months. Cloudflare's crawl-to-refer ratio is a single week in June 2025; Conductor aggregates May to September 2025; Chartbeat runs December 2024 to December 2025. In a channel growing at the rates reported, window length alone can separate two honest figures by a wide margin, and a short window can catch a spike. Where a source does not state its window at all, we cannot place the finding in time and it is quarantined to Tier B — that is why the Daily Mail figure below sits there.

    #window-delta

  4. 4 Referrer attribution

    What counts as an AI referral is not a settled question, and the boundary is often drawn by tooling rather than by choice. Conductor excludes Google's AI Mode traffic entirely, because Google Analytics classifies it with organic and AI Overview data without differentiating it. The Daily Mail reports that it cannot separate clicks originating in an AI Overview from ordinary search clicks — "it's all bundled in together." Two studies can therefore measure the same visitor and disagree about whether AI sent them.

    #attribution-delta

  5. 5 Panel versus site-side

    Each method sees a different slice of the web and cannot see the others. Pew observes 900 opt-in panellists through an app that records their browsing — excellent for behaviour, tiny and US-only. Ahrefs aggregates Google Search Console across 300,000 keywords — excellent for search, blind to everything that is not a Google result. Chartbeat sees its own client network of news sites; Cloudflare sees requests crossing its network. When these disagree it is frequently because they are not measuring the same population, not because one is wrong.

    #measurement-source-delta

  6. 6 Category mix

    The single most under-reported source of disagreement, and the easiest to demonstrate. Inside one study, one method and one dataset, Conductor reports Information Technology at 2.80% and Communication Services at 0.25% — an eleven-fold spread with no methodological difference at all. A cross-industry average therefore tells you very little about your own industry, and two studies sampling different industry mixes will disagree even when both are measured perfectly. This is why the reconciled ranges on this page are published per category rather than as one headline number.

    #category-mix-delta

  7. 7 Self-report, forecast, and the small-base problem

    Two distinct failures share this heading. The first is method we cannot check from the source in front of us. Similarweb's 357% year-on-year growth appears in a release that gives its window and its sample, but not its measurement method — so we catalogue it and set it aside. Not because it is wrong, and not as a comment on methodology the company documents elsewhere, but because that release does not let us test the figure. The second is arithmetic on a small base. Chartbeat reports ChatGPT referrals growing more than 200% year over year and AI accounting for less than 1% of pageviews. Both are true. Quoted alone, the first implies a transformation the second rules out: tripling a sub-1% channel leaves it a sub-3% channel. Growth figures without their base are the most common way these numbers mislead, and they mislead in the direction of whoever is quoting them.

    #self-report-delta

Study catalog

Every primary study this index reconciles, grouped by how it measured. This table is generated from the same records as the chart and the downloadable dataset.

StudyMethod & sampleWindowHeadline findingCaveatLink
1 · Behavioral
Google users are less likely to click on links when an AI summary appearsPew Research CenterNot plotted1 · BehavioralOpt-in panel whose members install an app that records browsing behaviour. Google results pages carrying an AI summary compared against pages without one.900 U.S. adults (KnowledgePanel Digital); 68,879 unique Google searches, 12,593 of which produced an AI summary2025-03-01 – 2025-03-318% vs 15%Share of VISITS to a results page on which the user clicked a traditional search result — not a share of searches, sessions or users.Google only; Pew states it could not reliably identify AI-generated summaries on other search engines. Results reflect how pages appeared when collected (7–17 April 2025), and an AI summary for a given search may change over time. Users clicked a source link inside the summary itself in just 1% of visits.
3 · Site-side
AI Overviews reduce clicks by 34.5%Ahrefs3 · Site-sideAggregated Google Search Console data: average desktop CTR per month (sum of clicks / sum of impressions) for the top-ranking page, keywords with an AI Overview against informational keywords without one.300,000 keywords — 150,000 with an AI Overview present, 150,000 informational keywords without2024-03-01 – 2025-03-31-34.5%Average desktop CTR for the top-ranking page on affected keywords — not sitewide traffic, and not all devices.Ahrefs states this is correlation, not proven causation, and that it relies on a forecast CTR model assuming AI Overviews behave like Featured Snippets. Alternative explanations for the decline are not eliminated.
AI chatbot share of publisher pageviewsChartbeat3 · Site-sideAggregated first-party analytics across Chartbeat's client network, counting AI chatbot referrals as a share of total pageviews.Billions of pageviews per month across thousands of news and media sites; exact site count not published2024-12-01 – 2025-12-31less than 1%Share of TOTAL pageviews across the network — not of referred traffic, and not of search traffic. Over the same window Google Search pageviews fell 34% and Google Discover fell 16%, so AI is not replacing the losses.The exact network size is not published — the source says only "thousands of news and media sites" — and the page carries no publication date. Chartbeat notes that AI traffic attribution is complicated and that dark social is harder to attribute, so the share is a floor. It also reports that small publishers see disproportionately larger search declines than large ones, so a network average conceals a wide spread between members.
ChatGPT referral growth to publishersChartbeat3 · Site-sideSame network and method as the share figure, measuring year-over-year change in ChatGPT referrals.Billions of pageviews per month across thousands of news and media sites; exact site count not published2024-12-01 – 2025-12-31more than 200%Growth measured against the same network a year earlier, from a base of well under 1% of pageviews. A large percentage rise on a very small base.The exact network size is not published — the source says only "thousands of news and media sites" — and the page carries no publication date. Chartbeat notes that AI traffic attribution is complicated and that dark social is harder to attribute, so the share is a floor. It also reports that small publishers see disproportionately larger search declines than large ones, so a network average conceals a wide spread between members. This growth figure should not be read without the share figure beside it: tripling a sub-1% channel leaves it a sub-3% channel.
2026 AEO / GEO Benchmarks Report — all industriesConductor3 · Site-sideAnonymised, aggregated analytics sessions across enterprise customer domains, separating AI-referred sessions from traditional organic search.13,770 domains across 10 industries; 3.3 billion+ sessions, of which 35.7 million were AI-related2025-05-01 – 2025-09-301.08%Share of ALL website traffic, not of referred traffic and not of search traffic — roughly one visit in a hundred.AI Mode traffic is excluded: Conductor states Google Analytics classifies it with organic/AIO data without differentiation, so this figure cannot include it. Note also an internal inconsistency in the source itself — the report describes 13,770 domains analysed, while its own limitations note describes data sourced from 1,215 enterprise customer domains. Enterprise domains are not a random sample of the web.
2026 AEO / GEO Benchmarks Report — Information TechnologyConductor3 · Site-sideSame dataset and method as the all-industry figure, segmented to the Information Technology industry under the Global Industry Classification Standard.Information Technology segment of 13,770 domains across 10 industries2025-05-01 – 2025-09-302.80%Share of all website traffic for IT-industry domains. The same study reports Communication Services at 0.25% and Utilities at 0.35% — an eleven-fold spread inside one method.AI Mode traffic is excluded: Conductor states Google Analytics classifies it with organic/AIO data without differentiation, so this figure cannot include it. Note also an internal inconsistency in the source itself — the report describes 13,770 domains analysed, while its own limitations note describes data sourced from 1,215 enterprise customer domains. Enterprise domains are not a random sample of the web.
4 · Network / CDN
Crawl-to-refer ratios on Cloudflare RadarCloudflare4 · Network / CDNRequests from a platform's crawler user agents answered with Content-type: text/html, divided by requests for HTML whose Referer header names that platform, measured across Cloudflare's network.Cloudflare network traffic; ratio published per AI platform2025-06-19 – 2025-06-2670,900:1Anthropic's ratio for the week shown. Referrals are counted only where a Referer header names the platform.Cloudflare states that traffic referred by Claude's native app carries no Referer header and believes the same holds for other native apps, so these ratios "may overstate the respective ratios, but it is unclear by how much". Mistral is published at 0.1:1 over the same week — a spread of five orders of magnitude between platforms.
Tier B — quarantined (2)

These records are catalogued for completeness and excluded from every reconciled range and from the chart's solid series. A study lands here when its method, sample or denominator cannot be established from a primary source — most often vendor-published figures with no disclosed methodology, or forecasts presented as measurements. Quarantine is not a claim that a figure is wrong. It is a statement that we cannot check it.

StudyMethod & sampleWindowHeadline findingCaveatLink
AI referral traffic winners by industrySimilarwebTier B2 · ClickstreamNot specified in the cited release, which describes proprietary algorithms applied to the top 1,000 websites worldwide. Similarweb documents its methodology elsewhere; this record reflects only what the cited release itself sets out.Top 1,000 websites worldwide2025-06-01 – 2025-06-30357%Growth in AI referral visits against June 2024: 1.13 billion AI referral visits, against 191 billion referrals from Google search over the same period.Tier B under our own rule, which asks that method, sample, denominator and window each be establishable from the source being cited. This release gives its window and its sample but not its measurement method, so we cannot test the figure from it. That is a limit on what this particular release lets us verify — not a judgement on the figure, and not a comment on the methodology Similarweb documents elsewhere.
Clickthrough rate where an AI Overview appearsDaily Mail (reported by Digital Content Next)Tier BPending primary verification3 · Site-sideA single publisher's own search analytics, comparing clickthrough where an AI Overview appears against where it does not.One publisher (Daily Mail)56.1% lower on desktopClickthrough rate on affected queries. The same source gives 48.2% lower on mobile — the device split is larger than many cross-study differences.Quarantined for two reasons stated in the source itself: the publisher says it cannot separate clicks originating from an AI Overview from ordinary search clicks — "it's all bundled in together" — and no measurement window is given, so the period cannot be established. The source also notes this publisher is unusually resilient (60%+ branded search, 50%+ direct), so it is not representative of publishers generally.

How to cite & licence

Suggested citation

Kingy AI Referral Index, Wave One, kingy.ai/ai-referral-index

Licence

The index data is published under CC BY 4.0. You may republish, chart and build on these figures, including commercially, provided you credit Kingy AI and link to kingy.ai/ai-referral-index. Attribution and the link are both required.

Dataset

Download the full catalog (CSV) 9 records

Press & corrections

Corrections and methodology questions: contact Kingy AI. Corrections are logged in the methodology changelog rather than applied silently.

Changelog & next wave

This is Wave One. Waves are quarterly. Each wave is archived at publication and never altered afterwards; method changes are appended to the methodology changelog, never applied silently.

Next wave: October 2026.