Use Claude for scientific research by giving it a bounded question, identifiable sources, an inspectable analysis task, and a clear definition of the files it must return. Check the sources and rerun the calculations before relying on the conclusion.
That approach works for ordinary research tasks: comparing papers, auditing a dataset, writing analysis code, and turning an observation into a testable hypothesis. It also makes mistakes easier to find.
Anthropic’s reported discovery of the ART enzyme system shows why this matters. The interesting result came from a research process involving data, tools, review, and experiments. For the distinction between a research lead and a validated application, read our companion guide to AI scientific discoveries and evidence.
This guide gives you a practical workflow, copyable prompts, and a public-data example you can reproduce. The example has a deliberate trap: one reasonable-looking data-cleaning command changes the sample unnecessarily, and one impressive correlation conceals important group differences.
Checked September 23, 2026. Kingy ran the Python analysis and verified the numerical results below. The Claude prompts are proposed workflows, not results from a paid Claude benchmark. Product capabilities are sourced to Anthropic’s documentation.
Choose the Claude tool that fits the task
“Claude for research” can refer to several interfaces. Choose based on what needs to happen to the evidence.
| Task | Starting point | What you should receive |
|---|---|---|
| Read and compare a defined set of papers | Claude with uploaded documents | A claim-by-claim comparison linked to document locations |
| Search a topic across sources | Claude’s Research feature | A search record, relevant references, and explicit coverage limits |
| Work with research databases and scientific analyses | Claude Science | Saved results with code, inputs, and provenance |
| Build or audit a local analysis project | Claude Code | Scripts, logs, output files, and instructions to rerun them |
The table is our task-based recommendation. Tool access depends on your account, enabled features, and the environment you connect.
Claude’s Research feature performs successive searches and returns a cited response. Anthropic’s current instructions place it in the chat “+” menu and require web search to be enabled. Use it to discover and orient yourself within sources, then verify the references that matter to your claim. Research documentation.
Claude Science is a research app in beta. The current getting-started page lists Pro, Max, Team, and Enterprise access, with an administrator enabling it for organizational plans. It describes code execution, scientific database connections, compute-cluster access, and versioned artifacts with provenance. Check the live installation documentation for platform requirements. Claude Science getting-started guide.
Claude Code can read a project, change files, and run commands. That makes it useful when you need the analysis to exist as a script you can inspect and rerun. Give it a dedicated working directory and explicit input and output paths. Claude Code overview.
Anthropic also documents connectors for sources such as PubMed, bioRxiv, and medRxiv. Database access helps retrieval; it does not establish that a returned paper supports the generated summary. Treat preprints as preprints and respect the access limits of each connected source. Life-sciences tools and connectors.
Start with a research brief
A short brief prevents an open-ended request from drifting into an attractive but unanswerable question. Specify the population or dataset, the outcome, the comparison, the evidence allowed, and the work product you need.
For example, “Study penguins” is too broad to check. “Describe the association between flipper length and body mass in this CSV, overall and separately by species” gives you a defined calculation and a direct way to verify it.
Use this prompt before asking for an analysis:
Help me turn this question into a research brief: [question].

Identify the population or dataset, unit of observation, outcome,
comparison, and the evidence needed to answer it.
Distinguish descriptive, predictive, and causal questions.
List missing information and assumptions. Do not fill gaps with
invented values or references.

Propose a bounded first analysis and name the files it should produce.
Explain what that analysis could establish and what it could not.
Read the proposed question yourself. If the dataset records observations but no intervention, a causal question may require additional assumptions or another study design. If the source only contains abstracts, a request for detailed methods may exceed the evidence available.
For unpublished, personal, or restricted data, confirm that your institution permits its use with the selected service and account configuration. Public data are a straightforward starting point for learning the workflow.
Use Claude for a literature review you can audit
Begin with inclusion criteria. Specify dates, subject area, study types, and which outcomes matter. Ask Claude to keep the search record separate from its interpretation.
Build a source map for [specific question].
Use [databases or supplied papers], covering [date range].
Include [study types]; exclude [exclusions].

For each source, return:
- verified title, authors, year, and DOI or stable URL;
- publication type and whether you accessed full text or only an abstract;
- population or dataset, method, and relevant result;
- the table, figure, section, or page supporting that result;
- limitations and relevance to my question.

Record search terms, databases, and search date.
Mark references you could not verify. Do not invent a DOI,
page number, or a claim about inaccessible full text.
Then inspect the sources behind the claims you intend to use. Check that the DOI resolves to the right paper, that the cited location exists, and that the result applies to the population being discussed. A correct title attached to an incorrect interpretation is still a sourcing failure.
Keep a simple evidence table:
| Claim | Source and location | Evidence observed | Interpretation | Limitation |
|---|---|---|---|---|
| The pooled penguin variables are positively associated | Saved CSV and results.json |
Pearson r = 0.871; n = 342 | A descriptive association in this sample | Does not identify a causal effect |
| A paper reports a treatment effect | DOI, version, table or section | Effect estimate and uncertainty | Interpretation appropriate to its study design | Population, comparator, bias, and generalizability |
The first row is from the worked example below. The second is a template, not a report about an actual study.
A search-assisted reading list is not automatically a systematic review. If your work is a systematic review, it needs an appropriate protocol, documented searches and screening, and reporting that fits the review type. PRISMA 2020 provides a reporting checklist and flow-diagram templates; using them does not by itself guarantee a rigorous search. PRISMA 2020 statement.
A worked example with public penguin data
We will answer a narrow question: How strongly are flipper length and body mass associated in the Palmer Penguins dataset, and does that relationship look the same within each species?
The dataset comes from work by Dr. Kristen Gorman and the Palmer Station Long Term Ecological Research program. The palmerpenguins package provides a convenient public version with 344 observations across three species. Its documentation distributes the data under CC0. Dataset documentation and attribution.
This is a teaching analysis of familiar data. It is not a new ecological discovery, a Claude capability score, or evidence about every penguin population.
Download the research starter kit. It contains the frozen CSV, a runnable standard-library Python script, saved results, prompts, an evidence-log template, and a research-brief template. Python 3.10 or newer is sufficient to reproduce the numerical results; the script makes no network or model calls.
First, inspect the data without changing it
Give Claude the CSV, or put the starter kit in a dedicated Claude Code or Claude Science working folder. Ask for an audit before fitting a model:
Inspect penguins.csv without modifying it.
Report row count, column names, units from the documentation,
missing values by column, and counts by species.

Our analysis variables are flipper_length_mm and body_mass_g.
Propose the missing-data rule for those variables and report exactly
how many rows it would retain. Do not remove rows solely because
another variable is missing. Flag apparent duplicates for review;
do not assume identical measurements are duplicate animals.

Save the input SHA-256 and audit findings before analysis.
For the snapshot used here, there are 344 rows. Two rows lack flipper length and body mass, leaving 342 complete pairs. Requiring every column to be present instead leaves 333 rows, because fields outside this question also contain missing values.
That nine-row difference is a useful check. A blanket dropna() would change the analytical sample because of variables the current calculation does not use. A missing-data rule should follow the question and study design.
Calculate the pooled and species-level associations
Ask for code and saved outputs:
Using rows with both flipper_length_mm and body_mass_g present,
calculate Pearson correlation overall and separately by species.
Return sample size for every correlation.

Save the analysis script and machine-readable results. Make a
scatterplot with units and species identified. Explain the difference
between the pooled and within-species results without claiming causation.
Do not add significance tests or search for a publishable finding.
Kingy reproduced the calculations locally with both Python’s standard-library statistics.correlation and pandas. The rounded results agree:
| Group | Complete pairs | Pearson correlation |
|---|---|---|
| All species pooled | 342 | 0.871 |
| Adelie | 151 | 0.468 |
| Chinstrap | 68 | 0.642 |
| Gentoo | 123 | 0.703 |
These figures describe this snapshot after the stated exclusions. They are not benchmark results from Claude.
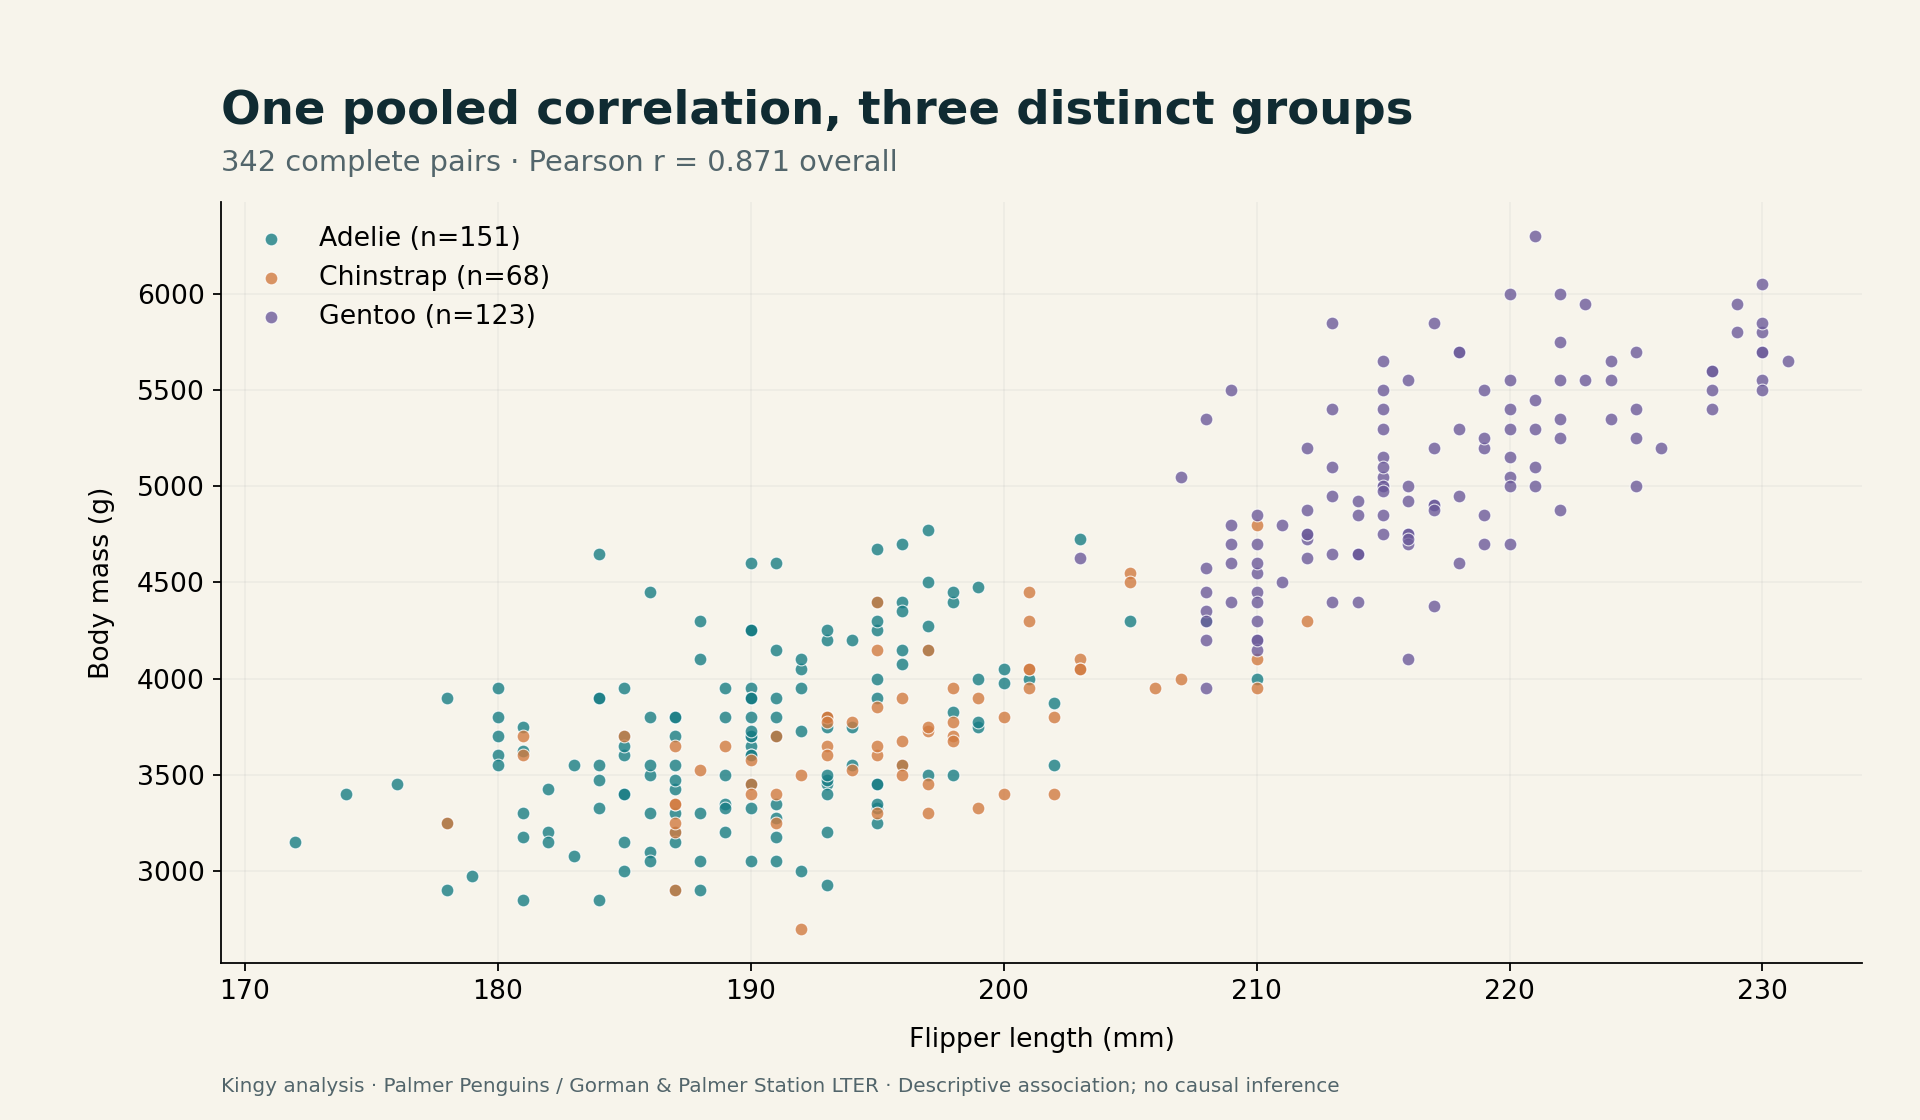
Kingy analysis of the Palmer Penguins data. Each point represents a complete pair of measurements. The pooled correlation is stronger than any of the three within-species correlations. Data: Gorman and Palmer Station LTER, distributed through palmerpenguins.
Interpret the difference before adding complexity
The pooled result describes a strong positive association across the combined sample. The species-level calculations ask a narrower question about variation within each group. Combining groups changes the relationship being summarized.
All four correlations are positive. This example does not show a reversal of the direction of association. Calling it a demonstrated case of Simpson’s paradox would overstate what these calculations establish.
The sample also does not show that increasing an individual penguin’s flipper length would cause its mass to rise. Species, sex, age, sampling structure, and other factors may be relevant to a deeper analysis. They require a defensible research design, not an improvised explanation attached to the correlation.
A useful next exploratory question is whether the within-species associations differ by sex. That would require a new missing-data rule, because sex is missing for some observations. Record it as a follow-up suggested by the exploration.
Rerun the result outside the conversation
Unzip the starter kit and run:
python reproduce_penguins.py
The script checks the frozen input’s SHA-256, reads the CSV, applies the stated rule, and writes results.json. The checksum identifies the exact bytes used; it does not certify the dataset’s scientific quality.
If you prefer pandas, the core calculation is short:
import pandas as pd

df = pd.read_csv("penguins.csv")
cols = ["flipper_length_mm", "body_mass_g"]
paired = df.dropna(subset=cols)

print("Input rows:", len(df))
print("Complete pairs:", len(paired))
print("Pooled r:", paired[cols[0]].corr(paired[cols[1]]))

for species, group in paired.groupby("species", sort=True):
    r = group[cols[0]].corr(group[cols[1]])
    print(species, len(group), round(r, 3))
An answer becomes much easier to assess when the reader can rerun the exact calculation that produced it.
Turn an observation into a testable hypothesis
Claude can help organize competing explanations and identify the observations that would distinguish them. Ask it to state what each explanation predicts, rather than ranking ideas by how persuasive the prose sounds.
Given this observation and the attached evidence, propose three
plausible explanations. For each, specify:
1. what evidence supports it;
2. an observation that would weaken it;
3. competing explanations or confounders;
4. a feasible next analysis or study that could distinguish them.

Separate established facts, assumptions, and speculation.
Do not describe any hypothesis as novel without a documented
literature check. Do not treat this dataset as independent confirmation
of a hypothesis generated by exploring it.
For confirmatory work, decide the primary outcome, comparison, exclusions, missing-data handling, and analysis method before inspecting the relevant outcome data wherever possible. Preregistration can document those decisions and make later departures visible. A genuinely untouched dataset or a new study can then test an exploratory finding. Center for Open Science guidance.
Keep the original plan and the revised plan. Changes can be justified; concealing their timing makes the result harder to interpret.
Check the failures that polished output can hide
The most useful review questions are specific enough to change the analysis.
| Failure | What to inspect | Corrective action |
|---|---|---|
| A citation exists but supports a different claim | The actual result, population, and cited location | Narrow or remove the claim |
| An abstract is presented as full-text evidence | What the tool accessed | Mark the access limit and obtain the needed source |
| Cleaning silently changes the sample | Row counts before and after each operation | Document exclusions and rerun |
| Units or denominators drift | Column definitions, formulas, table headings | Recalculate with consistent definitions |
| Test data influence modeling choices | Split design and preprocessing order | Redesign evaluation and keep evaluation data separate |
| Exploration becomes a “confirmed” result | When the hypothesis and analysis were chosen | Label it exploratory and plan an independent test |
| Several agents repeat one unsupported claim | The shared source and actual computation | Verify against evidence outside their agreement |
Data leakage deserves attention whenever you move into predictive modeling. In their research on machine-learning-based science, Kapoor and Narayanan explain how evaluation can become overoptimistic when information crosses boundaries that should keep training and testing separate. Primary research and taxonomy.
For example, several rows from one patient may not be independent observations. A random row split can put closely related information into both training and test data. Ask a domain expert what the correct unit of separation is before trusting a score.
You can use Claude to help audit these issues. Its review is an additional source of questions, not independent confirmation of its own answer.
Keep a record another researcher can use
Save the input data or permitted access instructions, source versions, analysis code, software versions, commands, outputs, and exclusions. Record the Claude model and interface used, the date, the relevant prompts, and any manual corrections.
Claude Science’s product documentation describes provenance that includes code, environment, and conversation context. Such records help reconstruction; you still need the relevant data, dependencies, and permissions to rerun the work. Claude Science’s provenance description.
For a small project, a folder containing data/, sources/, analysis/, and outputs/, plus a README and evidence log, is usually enough to begin. Prefer a small complete record over an elaborate structure nobody maintains.
When writing a paper, follow the target journal’s current disclosure requirements. ICMJE guidance, for example, requires disclosure of AI use and places responsibility for the submitted material with human authors. An AI tool is not an eligible author under that guidance. ICMJE recommendations on AI use.
Manage time and compute before expanding the search
Begin with one bounded task and a few representative inputs. Check that source retrieval, file access, analysis, and saved outputs work before running a larger campaign.
A useful stop condition names the deliverable: “Audit this CSV and produce one verified summary table.” An open request to “keep looking for interesting patterns” can generate substantial work without producing a result you can evaluate.
Record model usage, external compute, data-service charges, and review time separately when they apply. A subscription, API account, database connection, and compute cluster can have different billing arrangements. Check the relevant terms before a large run; this guide does not estimate a universal cost per research project.
Frequently asked questions
Can I use Claude for scientific research without coding?
You can begin with paper comparison, source organization, and research planning. For numerical analysis, Claude can help produce code, but someone still needs to check the method, inputs, and results. The starter kit lets you inspect a small complete example.
Can Claude write my literature review?
It can help search, organize, compare, and draft. You remain responsible for coverage, interpretation, attribution, and the accuracy of every cited claim. Define whether you are producing a reading overview, a narrative review, or a formal systematic review.
Is Claude Science the same thing as the Research button?
They serve different workflows. Research is a search feature in Claude; Claude Science is a dedicated environment for scientific work. Check the tool-selection section above for the documented capabilities and access links.
Which Claude model is best for research?
There is no single winner established by this guide. Evaluate the models available to you against a small task with known references or reproducible outputs. Compare source fidelity, method quality, successful completion, and cost under the same conditions.
Can Claude prove that my hypothesis is correct?
It can help formulate the hypothesis, identify relevant evidence, write analyses, and critique assumptions. The strength of the conclusion comes from the research design and results. A model’s confident wording does not supply a missing experiment.
For your first project, choose one question and require four outputs: a verified source list, a data audit, a runnable analysis, and a statement of what the result cannot establish. The starter kit provides a concrete place to begin.