| 1 · Behavioral |
|---|
| Google users are less likely to click on links when an AI summary appearsPew Research CenterNot plotted | 1 · BehavioralOpt-in panel whose members install an app that records browsing behaviour. Google results pages carrying an AI summary compared against pages without one.900 U.S. adults (KnowledgePanel Digital); 68,879 unique Google searches, 12,593 of which produced an AI summary | 2025-03-01 – 2025-03-31 | 8% vs 15%Share of VISITS to a results page on which the user clicked a traditional search result — not a share of searches, sessions or users. | Google only; Pew states it could not reliably identify AI-generated summaries on other search engines. Results reflect how pages appeared when collected (7–17 April 2025), and an AI summary for a given search may change over time. Users clicked a source link inside the summary itself in just 1% of visits. | Primary source for Google users are less likely to click on links when an AI summary appears (opens in a new tab) |
|---|
| 3 · Site-side |
|---|
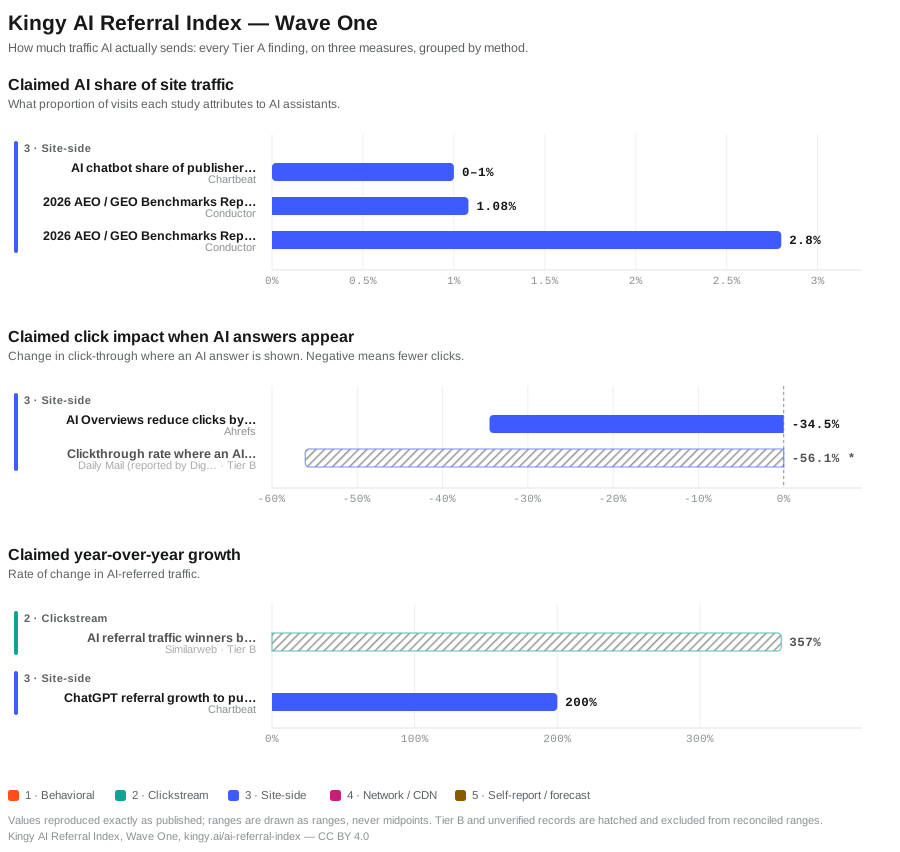
| AI Overviews reduce clicks by 34.5%Ahrefs | 3 · Site-sideAggregated Google Search Console data: average desktop CTR per month (sum of clicks / sum of impressions) for the top-ranking page, keywords with an AI Overview against informational keywords without one.300,000 keywords — 150,000 with an AI Overview present, 150,000 informational keywords without | 2024-03-01 – 2025-03-31 | -34.5%Average desktop CTR for the top-ranking page on affected keywords — not sitewide traffic, and not all devices. | Ahrefs states this is correlation, not proven causation, and that it relies on a forecast CTR model assuming AI Overviews behave like Featured Snippets. Alternative explanations for the decline are not eliminated. | Primary source for AI Overviews reduce clicks by 34.5% (opens in a new tab) |
|---|
| Update: AI Overviews Reduce Clicks by 58%Ahrefs | 3 · Site-sideAggregated Google Search Console data: average desktop CTR per month (sum of clicks / sum of impressions) for ranking pages, comparing keywords with an AI Overview against informational keywords without one; December 2023 baseline versus December 2025.300,000 keywords — 150,000 with an AI Overview present, 150,000 informational keywords without | 2023-12-01 – 2025-12-31 | -58%Average desktop CTR for the top-ranking (position 1) page on affected keywords — not sitewide traffic and not all devices. Separate position-level estimates range from -50.8% at position 2 to -19.4% at position 10. | Correlation, not proven causation. Ahrefs estimates a no-AI-Overview counterfactual by applying the non-AI-Overview keyword CTR change to the AI-Overview sample. Results depend on December 2025 keyword classification and aggregated Google Search Console data. | Primary source for Update: AI Overviews Reduce Clicks by 58% (opens in a new tab) |
|---|
| AI chatbot share of publisher pageviewsChartbeat | 3 · Site-sideAggregated first-party analytics across Chartbeat's client network, counting AI chatbot referrals as a share of total pageviews.Billions of pageviews per month across thousands of news and media sites; exact site count not published | 2024-12-01 – 2025-12-31 | less than 1%Share of TOTAL pageviews across the network — not of referred traffic, and not of search traffic. Over the same window Google Search pageviews fell 34% and Google Discover fell 16%, so AI is not replacing the losses. | The exact network size is not published — the source says only "thousands of news and media sites" — and the page carries no publication date. Chartbeat notes that AI traffic attribution is complicated and that dark social is harder to attribute, so the share is a floor. It also reports that small publishers see disproportionately larger search declines than large ones, so a network average conceals a wide spread between members. | Primary source for AI chatbot share of publisher pageviews (opens in a new tab) |
|---|
| ChatGPT referral growth to publishersChartbeat | 3 · Site-sideSame network and method as the share figure, measuring year-over-year change in ChatGPT referrals.Billions of pageviews per month across thousands of news and media sites; exact site count not published | 2024-12-01 – 2025-12-31 | more than 200%Growth measured against the same network a year earlier, from a base of well under 1% of pageviews. A large percentage rise on a very small base. | The exact network size is not published — the source says only "thousands of news and media sites" — and the page carries no publication date. Chartbeat notes that AI traffic attribution is complicated and that dark social is harder to attribute, so the share is a floor. It also reports that small publishers see disproportionately larger search declines than large ones, so a network average conceals a wide spread between members. This growth figure should not be read without the share figure beside it: tripling a sub-1% channel leaves it a sub-3% channel. | Primary source for ChatGPT referral growth to publishers (opens in a new tab) |
|---|
| 2026 AEO / GEO Benchmarks Report — all industriesConductor | 3 · Site-sideAnonymised, aggregated analytics sessions across enterprise customer domains, separating AI-referred sessions from traditional organic search.13,770 domains across 10 industries; 3.3 billion+ sessions, of which 35.7 million were AI-related | 2025-05-01 – 2025-09-30 | 1.08%Share of ALL website traffic, not of referred traffic and not of search traffic — roughly one visit in a hundred. | AI Mode traffic is excluded: Conductor states Google Analytics classifies it with organic/AIO data without differentiation, so this figure cannot include it. Note also an internal inconsistency in the source itself — the report describes 13,770 domains analysed, while its own limitations note describes data sourced from 1,215 enterprise customer domains. Enterprise domains are not a random sample of the web. | Primary source for 2026 AEO / GEO Benchmarks Report — all industries (opens in a new tab) |
|---|
| 2026 AEO / GEO Benchmarks Report — Information TechnologyConductor | 3 · Site-sideSame dataset and method as the all-industry figure, segmented to the Information Technology industry under the Global Industry Classification Standard.Information Technology segment of 13,770 domains across 10 industries | 2025-05-01 – 2025-09-30 | 2.80%Share of all website traffic for IT-industry domains. The same study reports Communication Services at 0.25% and Utilities at 0.35% — an eleven-fold spread inside one method. | AI Mode traffic is excluded: Conductor states Google Analytics classifies it with organic/AIO data without differentiation, so this figure cannot include it. Note also an internal inconsistency in the source itself — the report describes 13,770 domains analysed, while its own limitations note describes data sourced from 1,215 enterprise customer domains. Enterprise domains are not a random sample of the web. | Primary source for 2026 AEO / GEO Benchmarks Report — Information Technology (opens in a new tab) |
|---|
| 4 · Network / CDN |
|---|
| Crawl-to-refer ratios on Cloudflare RadarCloudflare | 4 · Network / CDNRequests from a platform's crawler user agents answered with Content-type: text/html, divided by requests for HTML whose Referer header names that platform, measured across Cloudflare's network.Cloudflare network traffic; ratio published per AI platform | 2025-06-19 – 2025-06-26 | 70,900:1Anthropic's ratio for the week shown. Referrals are counted only where a Referer header names the platform. | Cloudflare states that traffic referred by Claude's native app carries no Referer header and believes the same holds for other native apps, so these ratios "may overstate the respective ratios, but it is unclear by how much". Mistral is published at 0.1:1 over the same week — a spread of five orders of magnitude between platforms. | Primary source for Crawl-to-refer ratios on Cloudflare Radar (opens in a new tab) |
|---|