Between 20 and 26 July 2026, Koko Analytics recorded 88 pageviews carrying recognised AI-assistant referrers. Over the same seven days, raw Apache logs recorded 59,643 page requests carrying one of the named AI-crawler user agents in our published method.
Dividing the two aggregate counts produces 677.8 named AI-crawler page requests per visible AI-assistant-referred pageview. This is not a provider-matched exchange rate: the crawler list includes training, retrieval and general-purpose agents, while the referral count includes only visits carrying recognised assistant referrers.
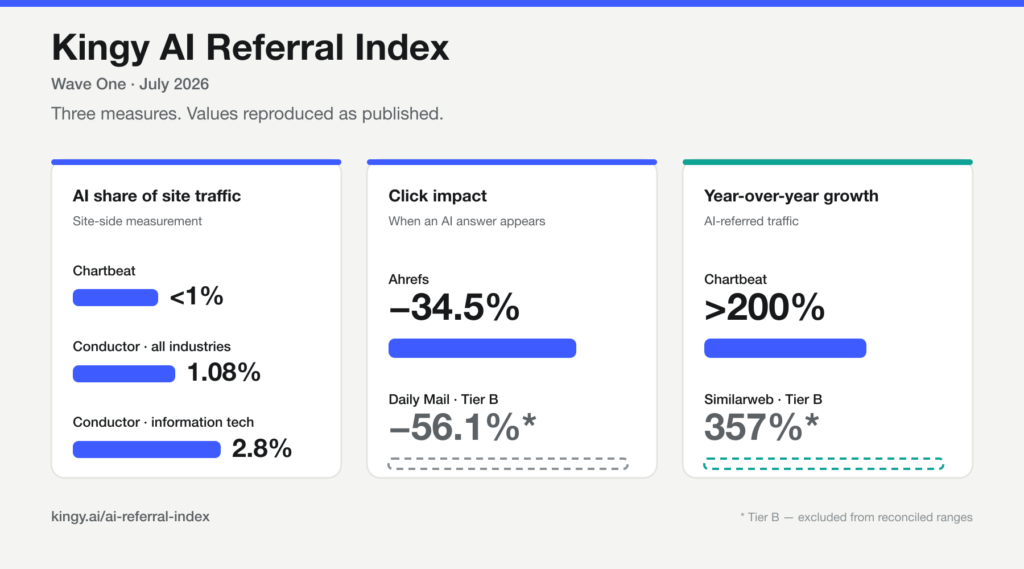
Today we are launching the Kingy AI Referral Index: a quarterly, versioned catalogue and methodological comparison of nine study records selected under Wave One’s published rules. It records the primary-source evidence, explains important measurement differences and states where the evidence remains too thin for reconciliation.
Our own books first
An index that grades other people’s measurement should show its own. Ours:
- 1.3279% of pageviews carried a recognised AI-assistant referrer (88 ÷ 6,627, 20–26 July 2026).
- 677.8 : 1 unmatched aggregate crawler-request-to-visible-referral ratio over the same seven days (59,643 ÷ 88).
The seven-day share was 88 ÷ 6,627 = 1.3279%; the non-overlapping trailing-twelve-month share was 2,325 ÷ 174,993 = 1.3286%. Both round to 1.33%, a difference of 0.00072 percentage points.
These counts come from different measurement systems. Koko’s JavaScript beacon does not count blocked pageviews, and assistants that omit or strip the referrer header are absent from the visible-referral count. Apache crawler identification is user-agent based and was not reverse-DNS verified. The aggregate therefore documents an observed asymmetry; it does not measure provider-level reciprocity or a literal exchange of pages for visits.
The studies disagree by more than an order of magnitude
Depending on which research you cite, AI referrals are a rounding error or a structural shift:
- Conductor puts AI at 1.08% of all website traffic across 13,770 domains and 3.3 billion sessions.
- Chartbeat reports less than 1% of pageviews across its network of news and media sites — while Google Search fell 34% and Google Discover fell 16% over the same period.
- Pew Research Center found users clicked a search result on 8% of visits where an AI summary appeared, against 15% where none did.
- Ahrefs measured a 34.5% lower click-through rate for top-ranking pages across 300,000 keywords.
- Cloudflare published a crawl-to-refer ratio for Anthropic of 70,900:1 in a single week — and 0.1:1 for Mistral. Five orders of magnitude, same week, same method.
These are not all wrong. Wave One identifies seven recurring measurement differences that can explain part of the spread. It does not quantify each delta’s contribution or demonstrate that the remaining estimates converge. Three examples follow.
The denominator
Share of what? Our seven-day figure is 88 ÷ 6,627 = 1.3279% of all pageviews. A previously published 2.8% referred-traffic comparison is withdrawn because its denominator could not be reproduced. Published figures are not always explicit about which denominator they use.
Category mix
Inside one study, one method and one dataset, Conductor reports Information Technology at 2.80% and Communication Services at 0.25% — an eleven-fold spread with no methodological difference at all. A cross-industry average tells you very little about your own industry.
The small-base problem
Chartbeat reports ChatGPT referrals growing more than 200% year over year and AI accounting for less than 1% of pageviews. Both are true. Quoted alone, the first implies a transformation the second rules out: tripling a sub-1% channel leaves it a sub-3% channel. Growth figures without their base are the most common way these numbers mislead — and they mislead in the direction of whoever is quoting them.
What Wave One does not claim
The index tiers every study. Tier A means method, sample, denominator and window can each be established from a primary source. Tier B is quarantined — catalogued in full, excluded from every reconciled figure. Quarantine is not an accusation that a number is wrong; it is a statement that we cannot check it.
By that standard, Wave One is thin, and the page says so rather than hiding it:
- Retail and commerce publishes no figure. The widely quoted retail numbers all trace to a single vendor’s analytics, and we could not reach that primary source to verify sample, window and denominator. We would rather show a gap than repeat a figure we have not read at source.
- Publishers and B2B each rest on one measurement method. The publisher card contains two Tier A findings from one underlying Chartbeat study; it is not two independent studies. Both cards therefore say plainly: treat the result as one study with error bars, not a reconciliation.
Every value is recorded exactly as published. A range stays a range and is never collapsed to a midpoint. “Less than 1%” is charted as a bounded span, not the point 1%. Where a source published a comparison rather than a figure — as Pew did — it is catalogued and excluded from the chart, and the exclusion is counted on the page. We would rather the chart be visibly incomplete than quietly wrong.
Use it
The full catalogue is downloadable as CSV, the chart as SVG and PNG, all under CC BY 4.0 — republish, chart and build on it, including commercially, with attribution and a link.
The methodology is versioned and every change is logged rather than applied silently. Original Wave One artifacts are preserved; evidence corrections are displayed as dated amendments so an earlier citation remains auditable. Wave Two is planned for October 2026, and its first job is the retail gap.
Read the Kingy AI Referral Index →
Corrections and methodology questions are welcome. If you believe a record misstates your study, tell us and we will check it against the primary source.