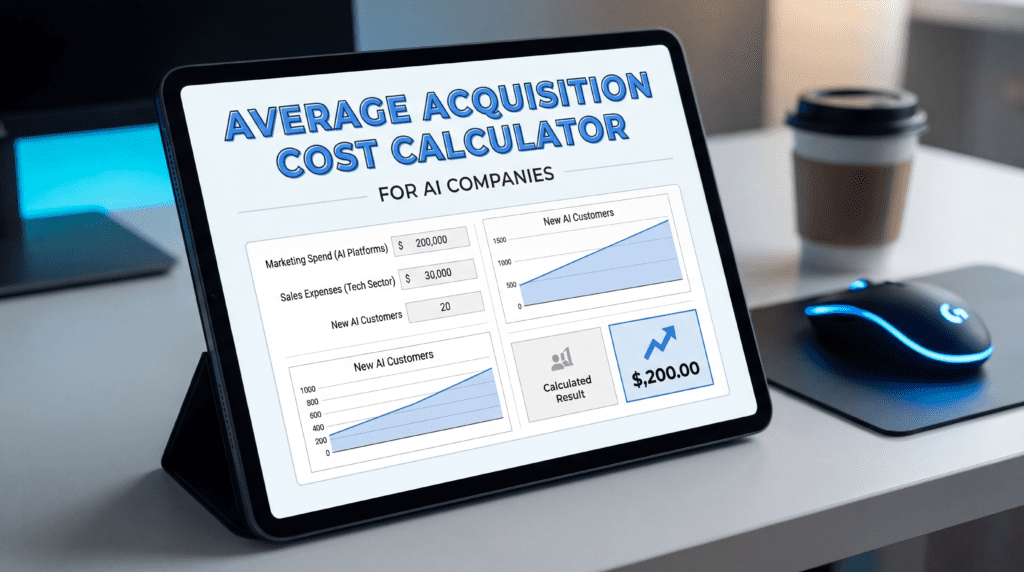
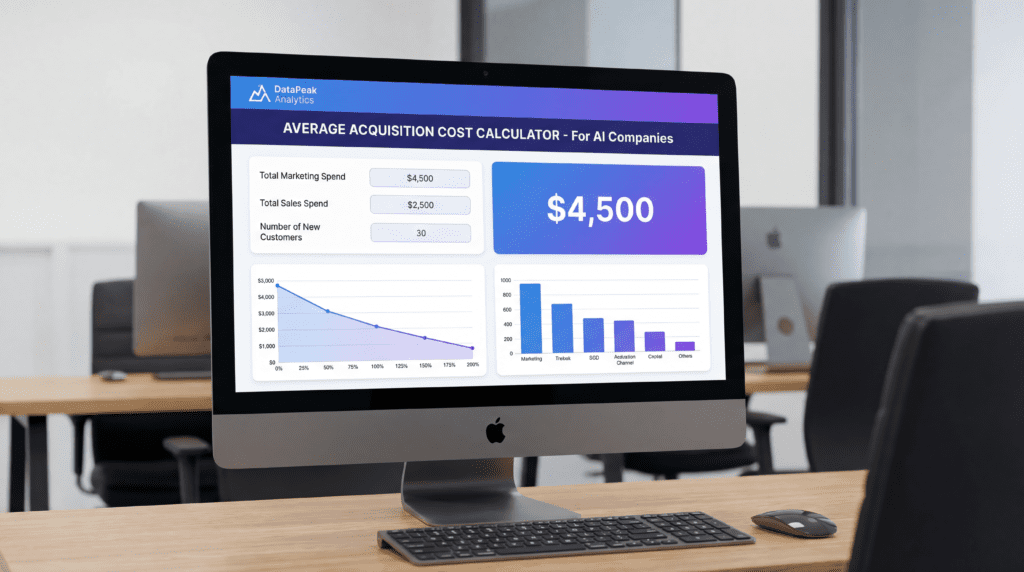
🤖 AAC Calculator for AI Companies
Average Acquisition Cost — tailored for AI/SaaS businesses
Enable if users self-serve and compute/trial costs drive acquisition.
💰 Sales & Marketing Costs (Monthly)
📊 Results
If you’ve just used our AAC Calculator above, you already have a number in front of you. But what does it actually mean? Why does it matter? And what separates an AI company that scales profitably from one that burns through runway chasing growth it can’t sustain? The answer almost always comes back to how well a company understands — and controls — its Average Acquisition Cost.
This guide breaks down everything behind that number: what it is, what goes into calculating it, and why getting it right is one of the most strategically important things an AI company can do.
What Is Average Acquisition Cost (AAC)?
Average Acquisition Cost (AAC) is the total amount of money a company spends, on average, to acquire a single paying customer. It is calculated by dividing your total acquisition-related spend over a given period by the number of new customers brought in during that same period.
At its core, it answers a simple question: How much does it cost us to get one customer through the door?
For traditional software or e-commerce businesses, this is already a nuanced calculation. For AI companies, it becomes significantly more complex — and significantly more important to get right. That’s because AI companies carry a unique set of cost structures that most standard sales and marketing frameworks were never designed to account for.
What Does the AAC Calculator Consider?
Our calculator is built specifically for the realities of AI-driven businesses. It breaks total acquisition costs into four distinct categories, each of which plays a different role in your overall spend.
1. Sales & Marketing Costs
This is the foundation of any acquisition cost calculation and includes the most visible line items: paid advertising across platforms like Google Ads, LinkedIn, and X (formerly Twitter); content marketing and SEO investment; event sponsorships and conference appearances (which, in the AI world, can mean significant spend at venues like NeurIPS, AI Summit, or AWS re:Invent); sales team salaries and commissions; and the software tools that support the sales process, such as CRM platforms, outreach tools, and analytics dashboards.
These costs are the most straightforward to capture, but even here, AI companies face nuances. For instance, conference sponsorships in the AI space have become disproportionately expensive as competition for developer and enterprise attention has intensified. And commission structures for enterprise AI deals — where sales cycles can run six to eighteen months — often look very different from those in conventional SaaS.
2. AI-Specific Acquisition Costs
This is where the calculator goes beyond what most standard AAC tools offer — and where AI companies most frequently make costly accounting errors.
Free trial compute costs are one of the largest overlooked expenses in AI acquisition. When a company offers a free tier, a sandbox environment, or a trial period, the GPU or TPU hours required to run inference or training for those users are a real, measurable cost. Many companies either ignore this entirely or bury it in general infrastructure spend, which distorts their true AAC significantly.
Free API credits and token giveaways are another major factor. Companies like OpenAI, Anthropic, and dozens of smaller AI API providers offer free usage tiers to attract developers. Those credits are not free to provide — they represent real compute expenditure, and attributing them correctly to acquisition cost is essential for an accurate picture of unit economics.
POC and demo fine-tuning costs come into play particularly at the enterprise level, where prospective clients often expect a proof-of-concept (POC) that demonstrates the AI’s performance on their specific data or use case. Running these exercises — which can involve custom fine-tuning, prompt engineering, and dedicated engineering hours — represents a direct cost tied to winning (or losing) that deal.
Integration demo builds and marketplace listing fees round out this category, covering the cost of maintaining a presence on hyperscaler marketplaces like the AWS Marketplace, Google Cloud Marketplace, or Azure Marketplace, as well as the engineering effort required to build and demonstrate integrations with popular enterprise tools.
3. People & Overhead
The human cost of acquisition is often the most significant — and the most underestimated. Sales engineers spend considerable hours on pre-sales discovery, technical demonstrations, and objection handling. Solution architects design custom implementation plans to make a prospect feel confident in committing. Legal and compliance teams review contracts, negotiate data processing agreements, and assess security questionnaires — all before a single dollar of revenue is recognized.
For AI companies selling into regulated industries such as healthcare, finance, or government, this compliance overhead can be substantial. A single enterprise deal might involve weeks of legal review, SOC 2 documentation, or GDPR impact assessments — all of which must be factored into what it actually cost to acquire that customer.
Reseller and affiliate fees, where applicable, also belong here. As AI companies increasingly leverage channel partners and co-sell relationships with hyperscalers, these commissions and revenue shares become a meaningful component of total acquisition spend.
4. LTV, Time Period, and Customer Segment
The calculator also incorporates Customer Lifetime Value (LTV) and allows you to model across different customer segments — SMB, Mid-Market, and Enterprise — because AAC does not exist in a vacuum. A $5,000 AAC looks very different when your average customer generates $1,000 in lifetime value versus $50,000. Understanding AAC in relation to LTV is what allows you to assess whether your acquisition engine is healthy or broken.
The time period selector matters too. Monthly AAC gives you a responsive, real-time view of efficiency. Quarterly smooths out volatility. Annual AAC is often the most useful for strategic planning and investor conversations, though it can mask emerging problems if reviewed infrequently.
The PLG Factor: Why AI Companies Need a Different Framework
One of the most important features in this calculator is the Product-Led Growth (PLG) toggle, and understanding why it exists requires understanding one of the defining shifts in how AI products go to market.
In a traditional sales-led model, the acquisition funnel is clear: marketing generates leads, sales converts them, and the cost of both is your AAC. In a PLG model — which underpins the growth strategies of companies like OpenAI, Midjourney, Hugging Face, and many others — the product itself is the primary acquisition channel. Users discover the product, self-serve through a free or freemium tier, and convert to paid on their own or through a low-touch sales motion.
This changes the AAC calculation fundamentally. In PLG, compute costs are acquisition costs. Every inference request from a free-tier user is a marketing expense. Every free token consumed by a developer testing your API is a lead-generation cost. Failing to account for this leads AI companies to dramatically underestimate what they’re actually spending to grow their user base.
The PLG toggle in our calculator adjusts the weighting of compute and API-related costs to reflect this reality, giving you a more accurate picture of your true acquisition economics if your growth model is product-led.
Why AAC Matters So Much for AI Companies Specifically
Beyond the calculation itself, it’s worth stepping back to understand why AAC deserves such close attention in the AI space — more so, arguably, than in almost any other category of technology company.
AI companies have unusually high pre-revenue costs. Building, training, and deploying an AI product requires significant infrastructure investment before a single customer ever sees it. When those costs bleed into the acquisition phase — as they often do through POCs, demos, and custom integrations — the true cost of bringing on a customer can be shockingly high if not carefully tracked.
Competitive pressure inflates acquisition spend. The AI market is one of the most competitive in technology right now. Companies are bidding against each other for attention on the same advertising platforms, competing for speaking slots at the same conferences, and offering increasingly generous free tiers to attract the same pool of developers. This environment structurally drives acquisition costs up, making discipline and measurement more important, not less.
The LTV:AAC ratio is the pulse of your business. Investors, operators, and boards use this ratio as one of the primary indicators of business health. A ratio below 1:1 means you are losing money on every customer you acquire — and no amount of scale will fix that. A ratio of 3:1 is generally considered the minimum threshold for a healthy, scalable business. Above 5:1 suggests strong unit economics and significant room to invest further in growth. Knowing your ratio — and knowing what’s driving it in either direction — is non-negotiable for any AI company serious about building a sustainable business.
Churn makes everything worse. Many AI companies, particularly those serving developers or early adopters, experience higher-than-average churn in their early months. A customer who churns after 90 days dramatically reduces LTV — which means your AAC, in effective terms, is much higher than it appears on paper. The calculator’s LTV inputs are designed to help you model this honestly, using your actual margin and lifespan data rather than optimistic projections.
How to Use Your AAC Number Strategically
Once you have a reliable AAC figure, it becomes a powerful strategic tool. Here’s how to put it to work:
Benchmark by channel. Your blended AAC is useful, but breaking it down by acquisition channel is where the real insight lives. If paid advertising is generating customers at $200 AAC while content marketing delivers them at $80, you have a clear signal about where to shift investment.
Set hiring targets. If you know your AAC and your LTV:AAC ratio, you can model how many sales engineers, solution architects, or marketing hires you can afford to make while maintaining healthy unit economics.
Guide pricing conversations. If enterprise deals have an AAC of $15,000 and your current pricing only generates $10,000 in LTV, the math doesn’t work — and that’s a pricing problem, not just a cost problem.
Communicate with investors. AAC, alongside LTV and churn, forms the backbone of the unit economics narrative that investors expect from any growth-stage AI company. Having clean, well-understood numbers in this area signals operational maturity and strategic clarity.
Final Thoughts
The Average Acquisition Cost calculator above is more than a number-crunching tool. It’s a framework for thinking clearly about one of the most consequential questions any AI company faces: Are we growing in a way that is actually creating value, or are we simply spending our way to a larger problem?
AI is a space defined by extraordinary ambition, extraordinary competition, and extraordinary capital requirements. The companies that succeed long-term will be those that combine technical excellence with financial discipline — and understanding your AAC, in all its complexity, is one of the clearest expressions of that discipline.
Use the calculator. Know your number. Then make it better.
Compare
Calculators
Continue Reading
The Kingy Brief
Get The Kingy Brief.
Every week: what launched, what changed price, and what scored well — built on KALI.
Weekly · Double opt-in · Unsubscribe anytime