

Estimate how much you can charge for sponsored videos based on your channel metrics.
YouTube Sponsorship Calculator
Estimate how much you can charge for sponsored videos based on your channel metrics
How Much Should I Charge For A Sponsored Youtube Video?
There is a particular kind of anxiety that grips a creator the moment a brand slides into their inbox with a partnership offer. The email is warm, the product seems like a fit, and somewhere near the bottom there is a line that reads: “What are your rates?” For most creators — even experienced ones — that question triggers a quiet panic. Do you quote too low and leave money on the table? Too high and lose the deal entirely?
The honest truth is that YouTube sponsorship pricing has historically been opaque, negotiated behind closed doors, and wildly inconsistent across channels of similar size. This calculator was built to fix that — or at least make a dent in it.
This article explains the pricing methodology behind the calculator, cross-references it against published industry benchmarks from Hootsuite, Shopify, sponsorship.so, ADOPTER Media, Vivian Agency, and others, and explains why each variable — tiers, niche multipliers, format types, and engagement ratios — was chosen and what real-world data supports it.

The Opacity Problem in Creator Pricing
Before diving into methodology, it’s worth understanding why this problem exists. Unlike traditional media buys — where a 30-second television spot or a banner CPM has decades of published precedent — YouTube influencer pricing evolved without guardrails. Brands and creators negotiate privately, agencies take cuts and rarely disclose rates, and creators are often explicitly told not to share their deal terms.
The result is a market full of information asymmetry that consistently favors buyers. According to InfluenceFlow’s 2025 creator guide, roughly 62% of creators feel underpaid for their work. Vivian Agency’s research goes further, noting that “brands almost always open 30–40% below their actual budget,” which means a brand with $8,000 available will typically open negotiations at $4,800 to $5,600. Creators who don’t know the market rate simply accept those first offers.
This is the core problem a transparent, data-driven calculator solves.
The Foundation: Influencer Tiers
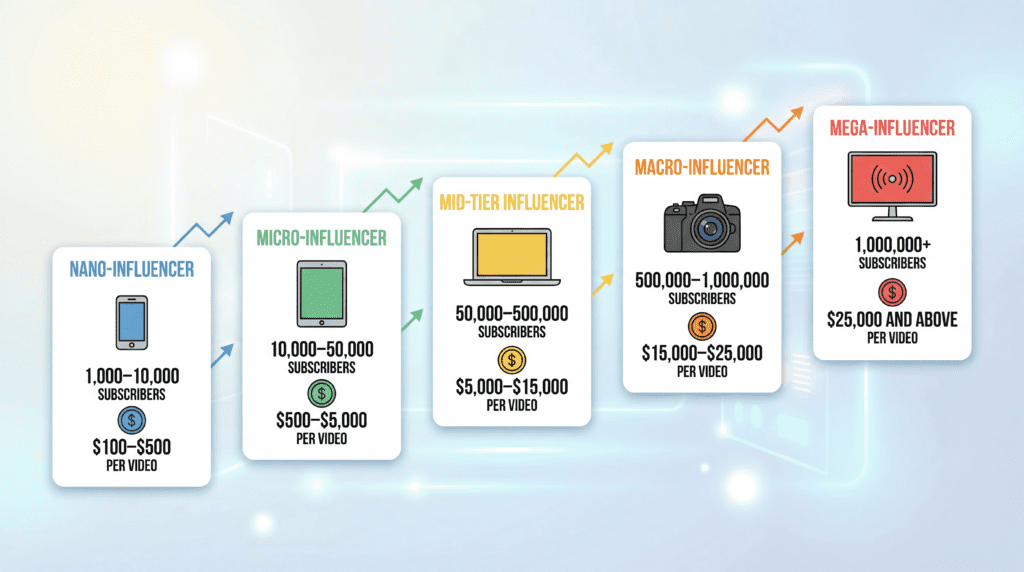
The most fundamental organizing principle in influencer marketing is the tier system — a classification of creators by audience size that gives both parties a starting point for pricing conversations. The calculator uses five tiers, and they map almost precisely to Hootsuite’s current industry standard:
- Nano-Influencer: 1,000–10,000 subscribers — $100–$500 per video
- Micro-Influencer: 10,000–50,000 subscribers — $500–$5,000 per video
- Mid-Tier Influencer: 50,000–500,000 subscribers — $5,000–$15,000 per video
- Macro-Influencer: 500,000–1,000,000 subscribers — $15,000–$25,000 per video
- Mega-Influencer: 1,000,000+ subscribers — $25,000 and above
These aren’t arbitrary numbers. They represent aggregated market data from years of industry observation. What’s notable is how consistent this tier structure is across multiple independent sources. Vivian Agency, drawing on Statista data, pegs nano channels at $100–$500 and notes that channels above 100K subscribers typically earn between $2,000 and $50,000 depending on a range of factors.
Sponsorship.so breaks it down similarly, with small YouTubers (1K–10K subscribers) earning $200–$2,500 for a dedicated sponsored video and large channels (100K+) commanding $5,000–$50,000 or more. Shopify’s 2026 influencer pricing guide, which synthesizes data from multiple agencies including inBeat, Impact.com, and IZEA, places YouTube nano rates at $200–$1,000 and mid-tier rates at $9,000–$25,000.
The calculator’s base ranges are deliberately conservative relative to sources like Shopify, which skew higher. This reflects a design choice: the tool is meant to give creators a floor to negotiate from, not an inflated ceiling. A creator who walks into a negotiation knowing they should be asking for at least $5,000 is in a much stronger position than one who was going to accept $800.
It’s also worth acknowledging why subscriber count is an imperfect but necessary starting variable. ADOPTER Media makes the point bluntly: “Sponsorship rates aren’t solely determined by view counts; they reflect how effectively a creator’s audience responds to brand messages.” That’s true, and the calculator accounts for it. But subscriber count still establishes a baseline that aligns with how brands actually think about reach, and it’s the first number any creator knows about their own channel.
Tier Progression: Why Position Within a Tier Matters
A crucial nuance that most flat-rate tier models miss is that a creator with 51,000 subscribers and a creator with 490,000 subscribers are both technically “mid-tier,” but they are not worth the same to a brand. The calculator addresses this through a tierProgress variable that interpolates the subscriber position within the tier’s range, scaling the base rate accordingly.
Specifically, as a creator moves from the bottom to the top of their tier, the base high rate scales from 40% of the tier ceiling to 100%, while the base low rate scales from the tier floor plus 30% of the gap. This produces a smooth, continuous curve rather than a hard step function.
The practical effect is that a 490,000-subscriber mid-tier creator receives an estimated rate close to the $15,000 ceiling of that tier, while a 51,000-subscriber creator gets a rate near the $5,000 floor — both of which align with what industry data actually shows at those specific audience sizes.
This kind of within-tier scaling is rarely discussed in pricing articles but is common practice in agency rate-setting, and it makes the calculator’s output meaningfully more accurate than a simple bracket lookup.
The Niche Multiplier: Where the Real Money Is Made
If there is a single variable in YouTube economics that creators consistently underestimate, it is their niche. OutlierKit’s 2026 CPM analysis, based on verified creator dashboard data, puts personal finance CPM at $15–$22, tech at $12–$18, and gaming at $9–$12 — a spread of nearly 2× at the extremes, from the same number of views. Lenos’s CPM and RPM breakdown is even more dramatic, placing finance CPM at $15–$50 and entertainment at $2–$8, representing a potential 6× differential.
This isn’t about the content itself — it’s about the value of the audience to advertisers. A viewer watching a video about index fund investing is likely to have disposable income, be actively researching financial products, and be close to a purchasing decision. A viewer watching a gaming highlights reel may be 14 years old with no credit card. Both are valuable audiences in different ways, but only one commands premium ad rates.
The calculator maps this into niche multipliers as follows:
| Niche | Multiplier |
|---|---|
| Finance, Business, and AI | 1.35× |
| Tech & Software | 1.25× |
| Education | 1.15× |
| Beauty & Fashion | 1.10× |
| Health & Fitness | 1.05× |
| Travel | 1.05× |
| Food & Cooking | 1.00× |
| Lifestyle & Vlogs | 0.95× |
| Gaming | 0.90× |
| Entertainment | 0.85× |
These multipliers are intentionally modest relative to the raw CPM differentials cited above, for a practical reason: CPM is an ad revenue metric, while sponsorship rates are negotiated separately from ad revenue. A finance channel that commands $50 CPM from Google’s ad network can legitimately charge more for a sponsorship, but that sponsorship rate doesn’t scale 1:1 with CPM because other factors — including the creator’s specific audience relationship, production quality, and the sponsor’s own ROI modeling — enter the equation.
The multipliers are designed to capture relative differences without overclaiming precision. Finance and AI at 1.35× and entertainment at 0.85× creates a 58% spread between the highest and lowest niches in the calculator. This is conservative compared to raw CPM data but reflects the reality that the correlation between ad CPM and sponsorship rate, while strong, is not perfectly linear.
The CPM data validates the directional ordering: upGrowth’s YouTube CPM analysis confirms that finance content generates CPMs of ₹250–₹400 (roughly $3–$5 in Indian markets, but significantly higher in US-focused channels), compared to lifestyle at ₹50–₹100. BossWallah’s industry breakdown notes that “finance, tech, and beauty creators get better rates because they attract specific audiences,” and that sponsorship earnings can swing 300–400% across niches.
Sponsorship Format Multipliers: Not All Deals Are Equal
The second major variable after niche is the type of sponsorship being offered. There is a vast difference between a dedicated video — where every minute of content serves the brand’s message — and a 15-second brief mention slipped into a video about something else entirely. The calculator captures this through format multipliers:
| Format | Multiplier |
|---|---|
| Dedicated Video | 1.0× (base) |
| Product Review | 0.9× |
| Product Integration | 0.7× |
| Brief Mention | 0.3× |
The dedicated video is the baseline because it represents the maximum value a creator can deliver: undivided audience attention, sustained message delivery, and a production specifically designed around the brand’s goals. Sponsorship.so describes dedicated videos as commanding the highest rates precisely because “the entire video showcases the brand” and the viewer knows they are watching branded content.
Product reviews are priced at 0.9× rather than at parity because they introduce a complication: authentic reviews may include negative observations, which reduces the brand’s control over messaging. They remain valuable — sponsorship.so notes that product reviews can rank in SEO search results and even appear in AI chatbot responses, providing long-tail value — but that slight discount reflects the reduced control brands receive.
Product integrations — the 60–90 second sponsored segment embedded naturally within organic content — sit at 0.7×. This is the industry workhorse. Vivian Agency’s 2026 guide notes that mid-roll integrations placed when “audience engagement and retention are still high” are the standard CPM benchmark format. The 0.7× discount relative to a dedicated video reflects that the creator’s content remains the primary focus, and the sponsorship message shares attention with non-branded material.
Brief mentions at 0.3× might seem low, but this reflects genuine market reality. A 15–30 second verbal mention with no visual integration, no demonstrated use, and no call-to-action infrastructure simply cannot deliver the same brand lift as a full dedicated video. The 0.3× factor means a creator who would charge $10,000 for a dedicated video should charge approximately $3,000 for a brief mention — which tracks with what Shopify’s pricing guide describes as the format distinction between “dedicated product review videos” and integrated mentions.
Engagement as a Modifier: The Views-to-Subscribers Ratio
The third and most nuanced variable is audience engagement. Every pricing guide agrees that engagement matters more than subscriber count in isolation. InfluenceFlow states it plainly: “A channel with 100K subscribers and 2% engagement earns more than 500K subscribers with 0.2% engagement.” ADOPTER Media puts it even more vividly: “A fitness influencer with 50,000 views might charge more than a general entertainment vlogger with 200,000 views.”
The challenge is choosing the right engagement metric. The traditional engagement rate — (likes + comments) / views — is easily gamed and doesn’t reflect the value most brands actually care about: how many of your subscribers actually watch your videos? A creator with 100,000 subscribers and 50,000 average views per video has a meaningfully more engaged audience than one with 100,000 subscribers and 3,000 average views.
The calculator uses the views-to-subscribers ratio (average views ÷ total subscribers) as its engagement proxy, mapped to six tiers:
| Views/Subs Ratio | Label | Multiplier |
|---|---|---|
| 50%+ | Exceptional | 1.35× |
| 30–50% | Excellent | 1.20× |
| 15–30% | Strong | 1.10× |
| 8–15% | Average | 1.00× |
| 3–8% | Below Average | 0.85× |
| Under 3% | Low | 0.70× |
This scale is calibrated to industry norms. For context, YouTube’s own ecosystem research has repeatedly shown that average view rates for established channels hover around 8–15% of subscribers per video — meaning a creator with 100,000 subscribers typically gets 8,000–15,000 views per upload. Anything above that baseline is genuinely strong; anything below 3% suggests either an inflated subscriber count, a topic mismatch between what people subscribed for and what’s being posted, or a channel that has lost its audience’s interest.
The 1.35× premium for exceptional engagement (50%+) represents a meaningful upside. A nano-creator with 5,000 subscribers who gets 3,000 views per video is delivering conversion potential that rivals a mid-tier creator with 5% engagement, because virtually every subscriber is watching. Brands that understand this — and sophisticated brands do — will pay a premium for that density of attention. The 0.70× discount for sub-3% engagement is equally justified: a channel where 97% of subscribers skip every video is offering sponsors reach without resonance.
BossWallah’s analysis validates this directionally, noting that “high watch time and active comments boost rates by 20–30%” — which corresponds closely to the 1.10× to 1.20× multipliers applied to the Strong and Excellent bands in the calculator.
The Mega-Tier Scaling Problem
One methodological challenge worth addressing separately is the mega-influencer tier. A creator with 1,000,001 subscribers and a creator with 50,000,000 subscribers are technically in the same “mega” tier, but they are obviously in completely different pricing universes.
The calculator handles this with a dedicated mega-tier scaling formula:
megaScale = min(4, subscribers / 1,000,000)
baseLow = tier.low × megaScale × 0.5
baseHigh = tier.high × megaScale × 0.8
This means a 1M-subscriber creator gets the base $25,000–$50,000 range (with megaScale = 1), while a 4M+ subscriber creator gets up to $50,000–$160,000 before niche and engagement multipliers are applied. The 4× cap is conservative but intentional — at the very top of the creator economy (channels with 20M+ subscribers), rates are entirely negotiated on a case-by-case basis and no calculator can responsibly estimate them.
Vivian Agency confirms that mega-influencers “can earn $20,000–$100,000+” per video, and that top-tier creators like MKBHD can command “$50,000–$100,000 or more” for a dedicated video. The calculator’s output for a 4M+ subscriber tech creator (megaScale × tech multiplier × exceptional engagement × dedicated format) would produce an estimate in the $80,000–$160,000 range — which aligns with those real-world observations.
Synthesizing the Variables: How the Formula Comes Together
The calculator’s final output is produced by multiplying five elements together:
- Tier base range (set by subscriber count)
- Tier position scaling (where within the tier the creator sits)
- Niche multiplier (0.85× to 1.35×)
- Format multiplier (0.3× to 1.0×)
- Engagement multiplier (0.70× to 1.35×)
The result is rounded to the nearest $50 for practical usability in negotiations. The minimum output of $10 exists as a safety floor, but in practice, any creator with 1,000 subscribers requesting a rate estimate will receive outputs well above that threshold.
To illustrate with a concrete example: a micro-influencer personal finance creator with 30,000 subscribers, 5,000 average views (16.7% engagement rate — “Strong”), requesting a dedicated video sponsorship would receive:
- Tier base (mid-micro): ~$1,800 low / ~$2,500 high
- Finance multiplier: ×1.35
- Dedicated format: ×1.0
- Strong engagement: ×1.10
- Final output: ~$2,700 – $3,700
Cross-referencing this with market data: InfluenceFlow’s case study describes a 35,000-subscriber productivity creator who successfully negotiated rates of $1,800–$2,000 per sponsorship before improving her media kit, and $2,000–$2,500 after. The calculator’s estimate for a similar creator in finance — a higher-value niche — at $2,700–$3,700 sits above that range in a logical and defensible way.
What the Calculator Doesn’t Account For (And Why)
Intellectual honesty requires acknowledging the variables that are outside scope. The calculator does not account for:
Geographic audience composition. InfluenceFlow notes that US and UK viewers are worth 3× more than Indian viewers for sponsorship purposes. A creator with 70% US audience should command a significant premium over an otherwise identical creator with a primarily Indian audience. Adding this to the calculator would require audience location data that most creators don’t know off the top of their head, but it’s an important manual adjustment to make when entering real negotiations.
Production quality and channel authority. A creator with award-quality production and a decade of consistent uploads in their niche has an intangible premium that no formula can fully capture. Vivian Agency describes production quality as a meaningful factor in rate negotiation, noting that “high-quality content commands higher rates.”
Usage rights and exclusivity. Shopify’s pricing guide emphasizes that exclusivity clauses — where a creator agrees not to work with competitors — “can significantly increase rates.” A calculator output should be treated as a baseline for the content delivery itself; usage rights and exclusivity should be negotiated as line-item additions.
Seasonal timing. CPMs peak in Q4, and brands generally have larger budgets available during certain campaign cycles. Rates negotiated in November for holiday campaigns should realistically be higher than those negotiated in January.
These are real limitations, and a creator should treat the calculator’s output as a floor rather than a ceiling — a defensible starting number that can only go up when additional value factors are presented.
Practical Guidance for Creators Using the Tool
The most effective way to use this calculator is as the opening of a conversation, not the end of one. Here is how to operationalize the output:
Use the estimate to anchor your minimum. When a brand asks for your rate, you should never say a number lower than the calculator’s low estimate. If the brand opens at half your estimate, you have data-backed reasoning to counter.
Apply geography and production adjustments manually. If your audience is heavily US-based, add a 20–30% premium to the estimate. If your production quality is meaningfully above average for your tier, add another 10–15%.
Treat the format multiplier as a negotiation tool. If a brand initially asks for a dedicated video but you’re not sure they need one, offer an integration at 70% of your dedicated rate. This often closes deals that stall on price while still delivering value to both parties.
Why Transparent Pricing Helps the Whole Ecosystem
It’s worth ending with the broader picture. When creators consistently underprice themselves, it creates a market-wide expectation that influencer content is cheap, which makes it harder for all creators — especially emerging ones — to negotiate fair rates. When brands consistently lowball, they undermine long-term creator relationships and ultimately undermine the authenticity that makes influencer content valuable in the first place.
Pricing tools, rate cards, and published benchmarks from platforms like Hootsuite and Shopify represent a genuine public good for the creator economy. They don’t eliminate negotiation — nothing does — but they shift the baseline upward for everyone.
This calculator was built on the same principle. Its methodology is transparent, its variables are grounded in published industry data, and its outputs are deliberately conservative so that any creator using it can defend their number in a room full of brand marketing managers. The goal was never to tell you the exact rate — that depends on too many specifics — but to make sure you walk into every negotiation knowing what floor you shouldn’t go below.
That, more than any specific formula, is the value it’s designed to deliver.
Estimates are based on industry benchmarks aggregated from Hootsuite, Shopify, sponsorship.so, Vivian Agency, ADOPTER Media, InfluenceFlow, OutlierKit, and Lenos. Actual rates vary based on audience geography, production quality, exclusivity terms, and individual negotiation.


Comments 1