Acquisition Cost Calculator
Digital marketing is awash in metrics. Campaign managers track everything from impressions and click-through rates to lead scores and conversion events. Yet when leadership asks "How much are we paying for each new customer?" or "Is this campaign profitable?", many teams scramble for an answer. Two metrics — cost per acquisition (CPA) and customer acquisition cost (CAC) — lie at the heart of these questions, and understanding them is essential for scaling any business sustainably.
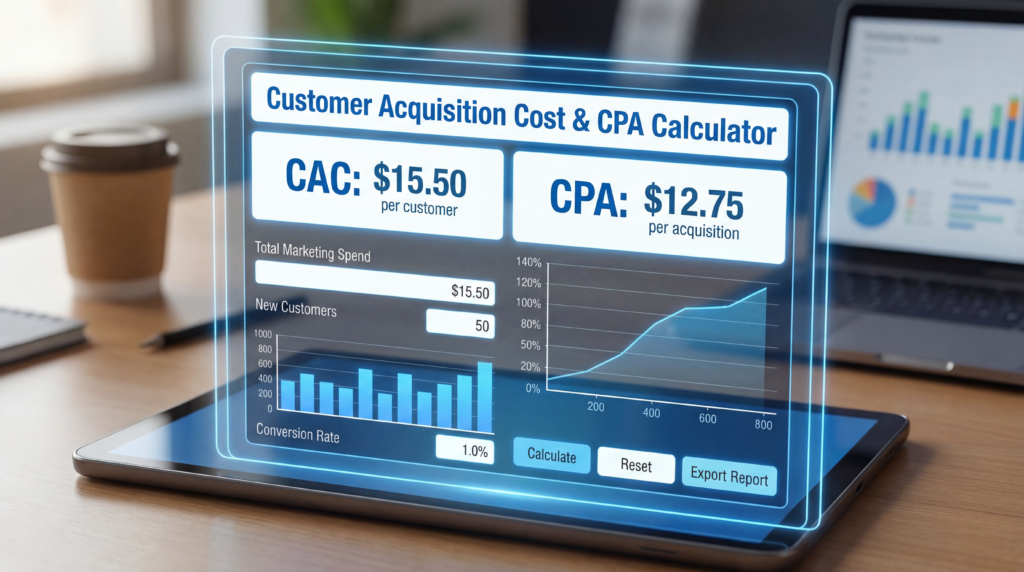
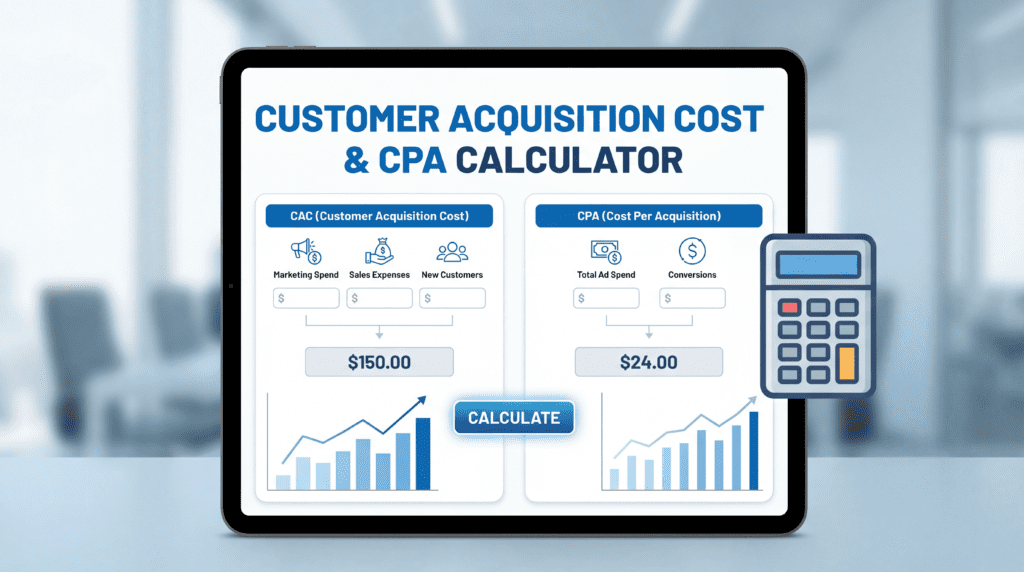
To help cut through the confusion, Kingy AI built a Customer Acquisition Cost & CPA Calculator that goes beyond the typical cost-per-action tool. It offers a clean interface that computes CPA or CAC, adjusts for fully loaded costs, and compares the result against revenue or profit to surface profitability and payback period. This article explains the reasoning behind each input and output, illustrates best-practice benchmarks, and walks you through how to use the calculator to make smarter budget decisions.
CPA vs. CAC — Two Sides of the Acquisition Coin
Cost per acquisition (CPA) and customer acquisition cost (CAC) are routinely used interchangeably. They shouldn't be — they measure fundamentally different things.
CPA looks at the cost associated with a single conversion action, such as a lead form submission, a free trial signup, or an app install. As ClickGuard explains, CPA focuses on "the cost of a specific action (signup, form submission, purchase)." Google Ads formalises this by defining a conversion action as any action you deem valuable — an online purchase, a phone call, an app download, or another customer interaction — noting that conversions can be tracked across sources ranging from websites to phone calls. Because CPA is tied to a single conversion event, it is ideal for channel optimisation: you can compare paid search, paid social, and affiliate programs side by side to find the lowest-cost path to a signup or install.
CAC, by contrast, measures the total cost of acquiring a paying customer. ClickGuard emphasises that CAC "encompasses the total costs related to the effective acquisition of a customer, including expenses from lead generation to transaction completion." It therefore captures not only advertising spend but every marketing and sales cost required to convert a lead into revenue.
Salesforce's guide to CPA notes that when calculating acquisition costs you must "list all costs directly related to the campaign," including advertising, operational costs, and personnel costs such as salaries or fees for dedicated staff. CAC paints the full picture of your unit economics and is the number leadership actually cares about when evaluating growth efficiency.
Why the Distinction Matters
The denominator differs. CPA divides campaign cost by the number of conversion events; CAC divides total acquisition cost by the number of new paying customers. If your funnel includes several stages — say, a free trial followed by a paid conversion — a low CPA on trial signups tells you almost nothing about CAC if most trials never convert. Companies need both: CPA for channel efficiency, CAC for overall profitability.
Why Track Acquisition Costs at All?
Marketing budgets are finite. Salesforce notes that CPA "acts as a compass that guides companies in their search for efficient campaigns." Without knowing how much it costs to acquire a customer, you may overspend on channels with poor conversion rates or underinvest in high-performing ones.
The real power of CAC comes from comparing it to customer lifetime value (CLV or LTV). Harvard Business School explains that a healthy LTV:CAC ratio of at least 3:1 signals scalability and profitability; a ratio below 1 means the company is losing money on every new customer. Shopify similarly notes that SaaS firms should target a 3:1 ratio, and that anything at 2:1 or below suggests a near break-even situation. These ratios transform a raw CAC figure into a strategic signal.
Breaking Down the Costs — Ad Spend vs. Fully Loaded CAC
One of the most common mistakes in CAC calculation is treating "ad spend" as the whole story. The Kingy AI calculator addresses this directly by letting you choose between two cost modes.
Ad Spend Only
This is appropriate when you want a narrow view of channel efficiency. It includes only direct advertising costs — paid search, paid social, display — that drive traffic or conversions. If you spent $5,000 on Google Ads and generated 100 trial signups, your CPA is $50 per signup. Useful for optimisation within a campaign, but incomplete for strategic decisions.
Fully Loaded CAC
For a true CAC, you must include every cost associated with bringing a customer onboard. Salesforce lists several categories: advertising spend, operational costs like content creation and landing page development, and personnel costs such as salaries or fees for dedicated marketing and sales staff. Its FAQ expands this list to include technology investments, event participation, customer support, SEO and SEM, production of sales materials, partnerships, affiliates, and data analysis.
The Kingy AI calculator's optional cost fields reflect these categories:
- Agency / freelancer fees — If you outsource campaign management or creative production, these fees are part of CAC because they directly support acquisition.
- Creative / production costs — Designing ads, landing pages, and video assets takes time and money. Salesforce classifies these as "content creation" and "graphic design" costs.
- Sales commissions — For products requiring a sales team, commissions paid to account executives are a genuine acquisition cost.
- Software / tools — Marketing automation, analytics platforms, and CRM systems often charge per-user fees and should be included.
- Salaries / allocated labor — Only the portion of staff time dedicated to acquisition campaigns should be allocated here.
Including these costs reveals the true cost of growth. For example, if your ad spend CPA is $50 but you pay $5,000 per month for marketing software and $20,000 in salaries for a marketing and sales team, fully loaded CAC may exceed $100 per customer — and if your product sells for $80, that's a serious problem that narrow CPA numbers would never expose.
Counting Acquisitions — Why the Denominator Matters
The denominator in any CPA or CAC formula is the number of acquisitions, but what counts as an acquisition varies by business objective. The calculator allows you to specify:
- New customer — Use this when calculating true CAC. Only paying customers count; free users who never convert should not be included in the denominator.
- Trial signup, demo booked, lead form, or app install — Use these when measuring CPA at earlier funnel stages. If your campaign objective is free trial signups, dividing total spend by signups gives you cost per trial. You can then layer in conversion-to-paid rates to estimate your final CAC.
The critical rule: count only the conversions relevant to your chosen type. If you select "new customer," exclude leads and trial signups that haven't yet paid. Accuracy in the denominator directly determines the reliability of your CAC figure.
Revenue Models — One-Time Purchases vs. Subscriptions
Acquisition metrics are only meaningful when set against revenue. Different businesses generate revenue in fundamentally different ways, so the calculator asks you to choose between two models.
One-Time Purchase
In a one-time purchase model, the key revenue metric is average order value (AOV). Amplitude defines AOV as the metric representing the typical dollar value of a customer's total order, calculated by dividing total revenue over a period by the number of orders. If you generate $100,000 from 2,000 orders in a quarter, your AOV is $50.
If your business sells contracts or licenses rather than discrete orders, average contract value (ACV) may be more appropriate. Zenskar notes that ACV measures the average annual revenue per customer contract, distinguishing it from annual recurring revenue (ARR), which aggregates across all contracts. In the Kingy AI calculator, the "Revenue per acquisition (AOV/ACV)" field accepts either figure — just enter the average revenue you earn per acquisition event.
Subscription
Subscription businesses generate revenue over time, making monthly recurring revenue (MRR) per customer the more relevant input. Enter your monthly subscription price and the calculator uses it to compute the CAC payback period — the number of months required to recoup the cost of acquiring each customer. You can also optionally enter a customer LTV figure if you have a reliable estimate; if so, the calculator adds an LTV:CAC ratio to the output.
Gross Margin — Revenue Isn't the Same as Profit
Revenue is not profit. To understand true profitability, you must account for gross margin — the portion of revenue remaining after direct costs are subtracted. The Business Development Bank of Canada (BDC) defines gross margin as "the portion of business revenue left over after you subtract direct costs, such as labour and raw materials."
A positive gross margin indicates the business makes money on each sale after covering production costs; a negative gross margin signals that costs exceed revenue — an unsustainable position. BDC emphasises that gross margin is the first stage of financial performance analysis and that failing to achieve a positive gross margin is simply not viable long-term.
The calculator's optional gross margin field lets you enter a percentage to convert revenue per acquisition into profit per acquisition. If your product has a 60% gross margin and an AOV of $100, profit per acquisition is $60. The calculator uses this adjusted figure for both the LTV:CAC ratio and the payback period, giving you a profitability-based view rather than a purely revenue-based one.
Understanding LTV and CLV
Customer acquisition costs are only meaningful when compared to what a customer is worth. Salesforce defines customer lifetime value (CLV) as the total revenue a business can expect from a customer throughout the entire relationship. A more complete formula subtracts the total cost to serve the customer, highlighting net profit contribution rather than gross revenue.
In subscription businesses, LTV is typically estimated by multiplying average revenue per customer by expected customer lifespan (in months) and adjusting for gross margin. The figure reflects each customer's long-term contribution and determines how much you can rationally afford to spend on acquisition. Higher LTV unlocks higher permissible CAC; lower LTV demands a leaner acquisition strategy.
If you provide an LTV figure in the calculator, it divides that number by CAC to produce the LTV:CAC ratio. If you leave LTV blank but enter monthly revenue and gross margin, the calculator instead computes the payback period — a complementary metric that tells you how long it takes to recover your acquisition investment.
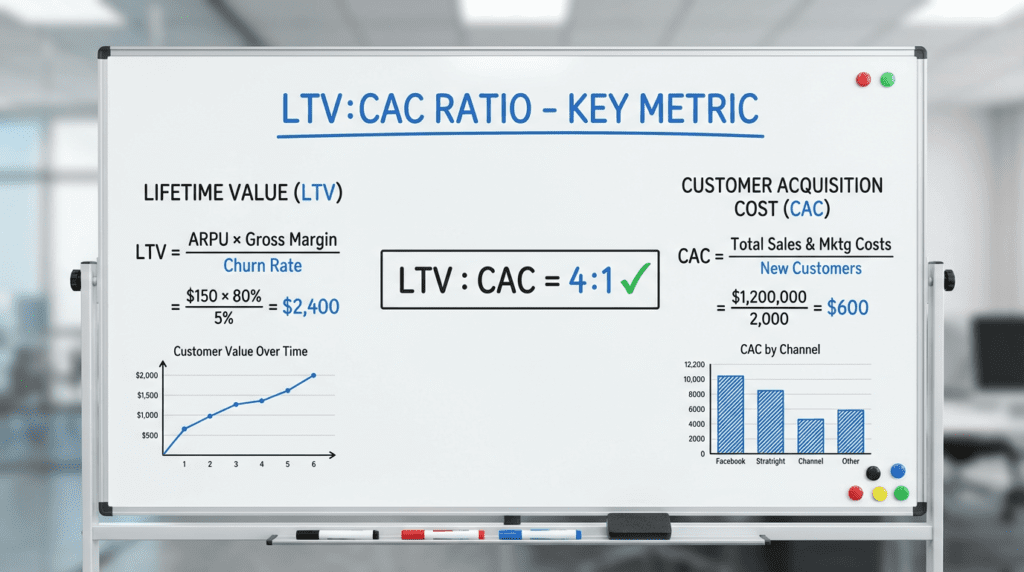
LTV:CAC Ratio — Benchmarks That Matter
Multiple authoritative sources converge on similar benchmark guidance for the LTV:CAC ratio:
Healthy (≥3:1): Harvard Business School notes that a ratio of three or higher indicates scalability and the ability to cover marketing costs while generating profit. ClickGuard similarly advises aiming for at least 3:1 but cautions that a ratio above 4:1 might imply underinvestment in growth — leaving money on the table.
Borderline (2:1 to <3:1): Shopify states that SaaS companies typically aim for 3:1, and that a ratio of 2:1 or less signals near break-even economics. In this zone, you may need to improve margins, increase retention, or reduce acquisition costs to build a sustainably profitable business.
Unprofitable (<2:1): Ratios below two indicate that CAC is approaching or exceeding the profit generated by each customer. Harvard Business School notes that ratios below one mean the company is losing money on every new customer — a situation that cannot be solved by growth alone.
The Kingy AI calculator uses these thresholds to label results as "Profitable," "Borderline," or "Unprofitable." Treat these as directional signals rather than absolute verdicts, always interpreting them in the context of your industry and growth stage.
CAC Payback Period — When Do You Break Even?
For subscription businesses, the CAC payback period is equally important to the LTV:CAC ratio. Geckoboard defines it as the number of months required to earn back the money invested in acquiring customers. The formula is straightforward:
CAC Payback Period = CAC ÷ (Monthly Revenue per Customer × Gross Margin %)
Geckoboard notes that the general benchmark for startups is to recover CAC within 12 months, with high-performing SaaS companies recouping it in as little as 5–7 months. Larger enterprises with access to more capital may tolerate longer payback periods. Wall Street Prep echoes this, stating that most viable SaaS startups should target a payback period under 12 months, and that longer payback periods signal elevated risk and potential capital pressure.
Investor David Skok warns on For Entrepreneurs that many startups take 15–18 months to recoup acquisition costs — a timeline that puts enormous strain on cash flow and underscores the importance of keeping CAC low enough to be recovered within a year.
The Kingy AI calculator computes payback period automatically when you provide monthly revenue and gross margin, then classifies the result: under 12 months is "Profitable," 12–18 months is "Borderline," and beyond 18 months is "Unprofitable."
Step-by-Step: Using the Kingy AI Acquisition Cost Calculator
Each input in the calculator maps directly to a component of the CPA/CAC or profitability formula.
1. Select the acquisition type. Choose from New customer, Trial signup, Demo booked, Lead/form fill, or App install. Selecting "New customer" labels the result Customer Acquisition Cost (CAC); all other options produce a Cost per Acquisition (CPA) label. Remember: only paying customers belong in the CAC denominator.
2. Enter total campaign spend. Input your advertising spend or the total of all acquisition costs over the measurement period. If you plan to use "Fully loaded" mode, you can enter ad spend here and add additional cost components in the next step.
3. Choose cost mode. Select "Ad spend only" for a narrow channel-efficiency view, or "Fully loaded CAC" to include all acquisition costs. The fully loaded option reveals additional fields for agency fees, creative production, sales commissions, software and tools, and salaries. Salesforce advises that operational costs, personnel costs, and other campaign-specific expenses should all be included for an accurate CAC figure.
4. Input the number of acquisitions. Enter the count of conversions matching your chosen acquisition type. For CAC, count only paying customers. For CPA, count relevant actions (signups, demos, installs). The calculator will prompt you if you enter zero or a negative value.
5. Select the revenue model. Choose "One-time purchase" and enter your AOV or ACV in the "Revenue per acquisition" field. Or choose "Subscription," enter monthly revenue per customer, and optionally enter an LTV figure if you have one. Leaving LTV blank allows the calculator to compute payback period without the ratio.
6. Enter gross margin (optional). Input your gross margin percentage to shift profitability calculations from revenue to profit. As BDC highlights, gross margin is the foundational measure of financial health — and computing LTV:CAC on revenue rather than profit can significantly overstate economic viability.
7. Click Calculate. The results panel displays your per-acquisition cost (labelled CAC or CPA depending on your selection), total acquisitions, cost mode used, status classification, LTV:CAC ratio (where applicable), and CAC payback period (for subscription models with monthly revenue entered).
Interpreting Your Results
Per-acquisition cost: If your CAC is high relative to your product's price or margin, it's time to refine targeting, test new creative, or explore lower-cost channels. If the result is CPA for a non-customer action like a trial signup, compare it against subsequent conversion rates to understand the full acquisition journey and estimate true CAC.
LTV:CAC ratio: Ratios at or above 3:1 suggest healthy unit economics and room to scale. The 2:1–3:1 zone calls for margin improvement, better retention, or reduced acquisition costs. Below 2:1, you're spending more to acquire customers than they return in profit — a problem that compounds with scale rather than resolving itself.
CAC payback period: For subscription businesses, a payback period under 12 months signals strong product-market fit and efficient capital deployment. A payback of 15–18 months puts pressure on cash flow and may require raising additional capital to sustain growth. Early-stage startups often have longer payback periods, but reducing that figure should be an explicit strategic goal.
Cost mode comparison: Running the calculator twice — once with ad spend only, once with fully loaded costs — can be illuminating. If fully loaded CAC is dramatically higher than ad-spend-only CPA, examine which cost components are driving the gap. Agency fees or software subscriptions may be candidates for renegotiation; high salary allocations may indicate an overstaffed acquisition function relative to output.
Best Practices for Optimising CPA and CAC
Focus on high-quality channels. Use CPA comparisons to allocate budget toward channels with the lowest cost per conversion and highest conversion-to-customer rates. Pause or restructure underperforming channels rather than spreading budget evenly.
Refine your targeting. Salesforce highlights that audience segmentation enables more precise targeting, increasing conversion rates and reducing CPA. Narrowing your audience to high-intent segments typically improves both CPA and downstream conversion quality.
Invest in creative and user experience. High-quality ad creative and a frictionless post-click experience boost conversion rates. Track creative production costs in your CAC calculation, however — investments that reduce CPA but balloon production spend may not improve fully loaded CAC.
Increase customer value. Higher AOV and ACV directly improve the LTV:CAC ratio. Amplitude notes that AOV can be improved by analysing customer behaviour and running pricing and bundling experiments. For subscription businesses, product adoption and expansion revenue are key levers.
Reduce churn and extend customer lifespan. Retention is the most overlooked lever in the LTV:CAC equation. Salesforce's CLV guide emphasises that customer satisfaction, ease of doing business, and product adoption all affect lifetime value. Investments in onboarding, customer success, and ongoing engagement directly improve LTV and the ratio.
Monitor gross margin carefully. BDC warns that misallocating expenses — for example, recording all labour under cost of goods sold — can understate gross margin and lead to poor strategic decisions. Regularly review your cost allocations, pricing, and supplier contracts to maintain the margins that make profitable acquisition possible.
Conclusion: Take Control of Your Acquisition Economics
Understanding acquisition costs isn't just an accounting exercise — it's a strategic imperative. By distinguishing CPA from CAC, accounting for all relevant costs (not just ad spend), and comparing those costs against revenue and profit, you gain a clear and honest view of your unit economics.
Benchmarks from Harvard Business School, Shopify, ClickGuard, Geckoboard, and Wall Street Prep give you targets to aim for, but your own data will always tell the truest story. The Kingy AI calculator simplifies the math: enter your inputs, click calculate, and instantly see your cost per acquisition, LTV:CAC ratio, and payback period in one clean view.
Use these numbers to optimise campaigns, allocate budget to what's working, renegotiate costs that are quietly inflating your CAC, and ultimately build an acquisition engine that is not just growing — but growing profitably.